> ## Documentation Index
> Fetch the complete documentation index at: https://docs.odigos.io/llms.txt
> Use this file to discover all available pages before exploring further.
# Building a pipeline
## Choosing target applications
You should now see the following page:
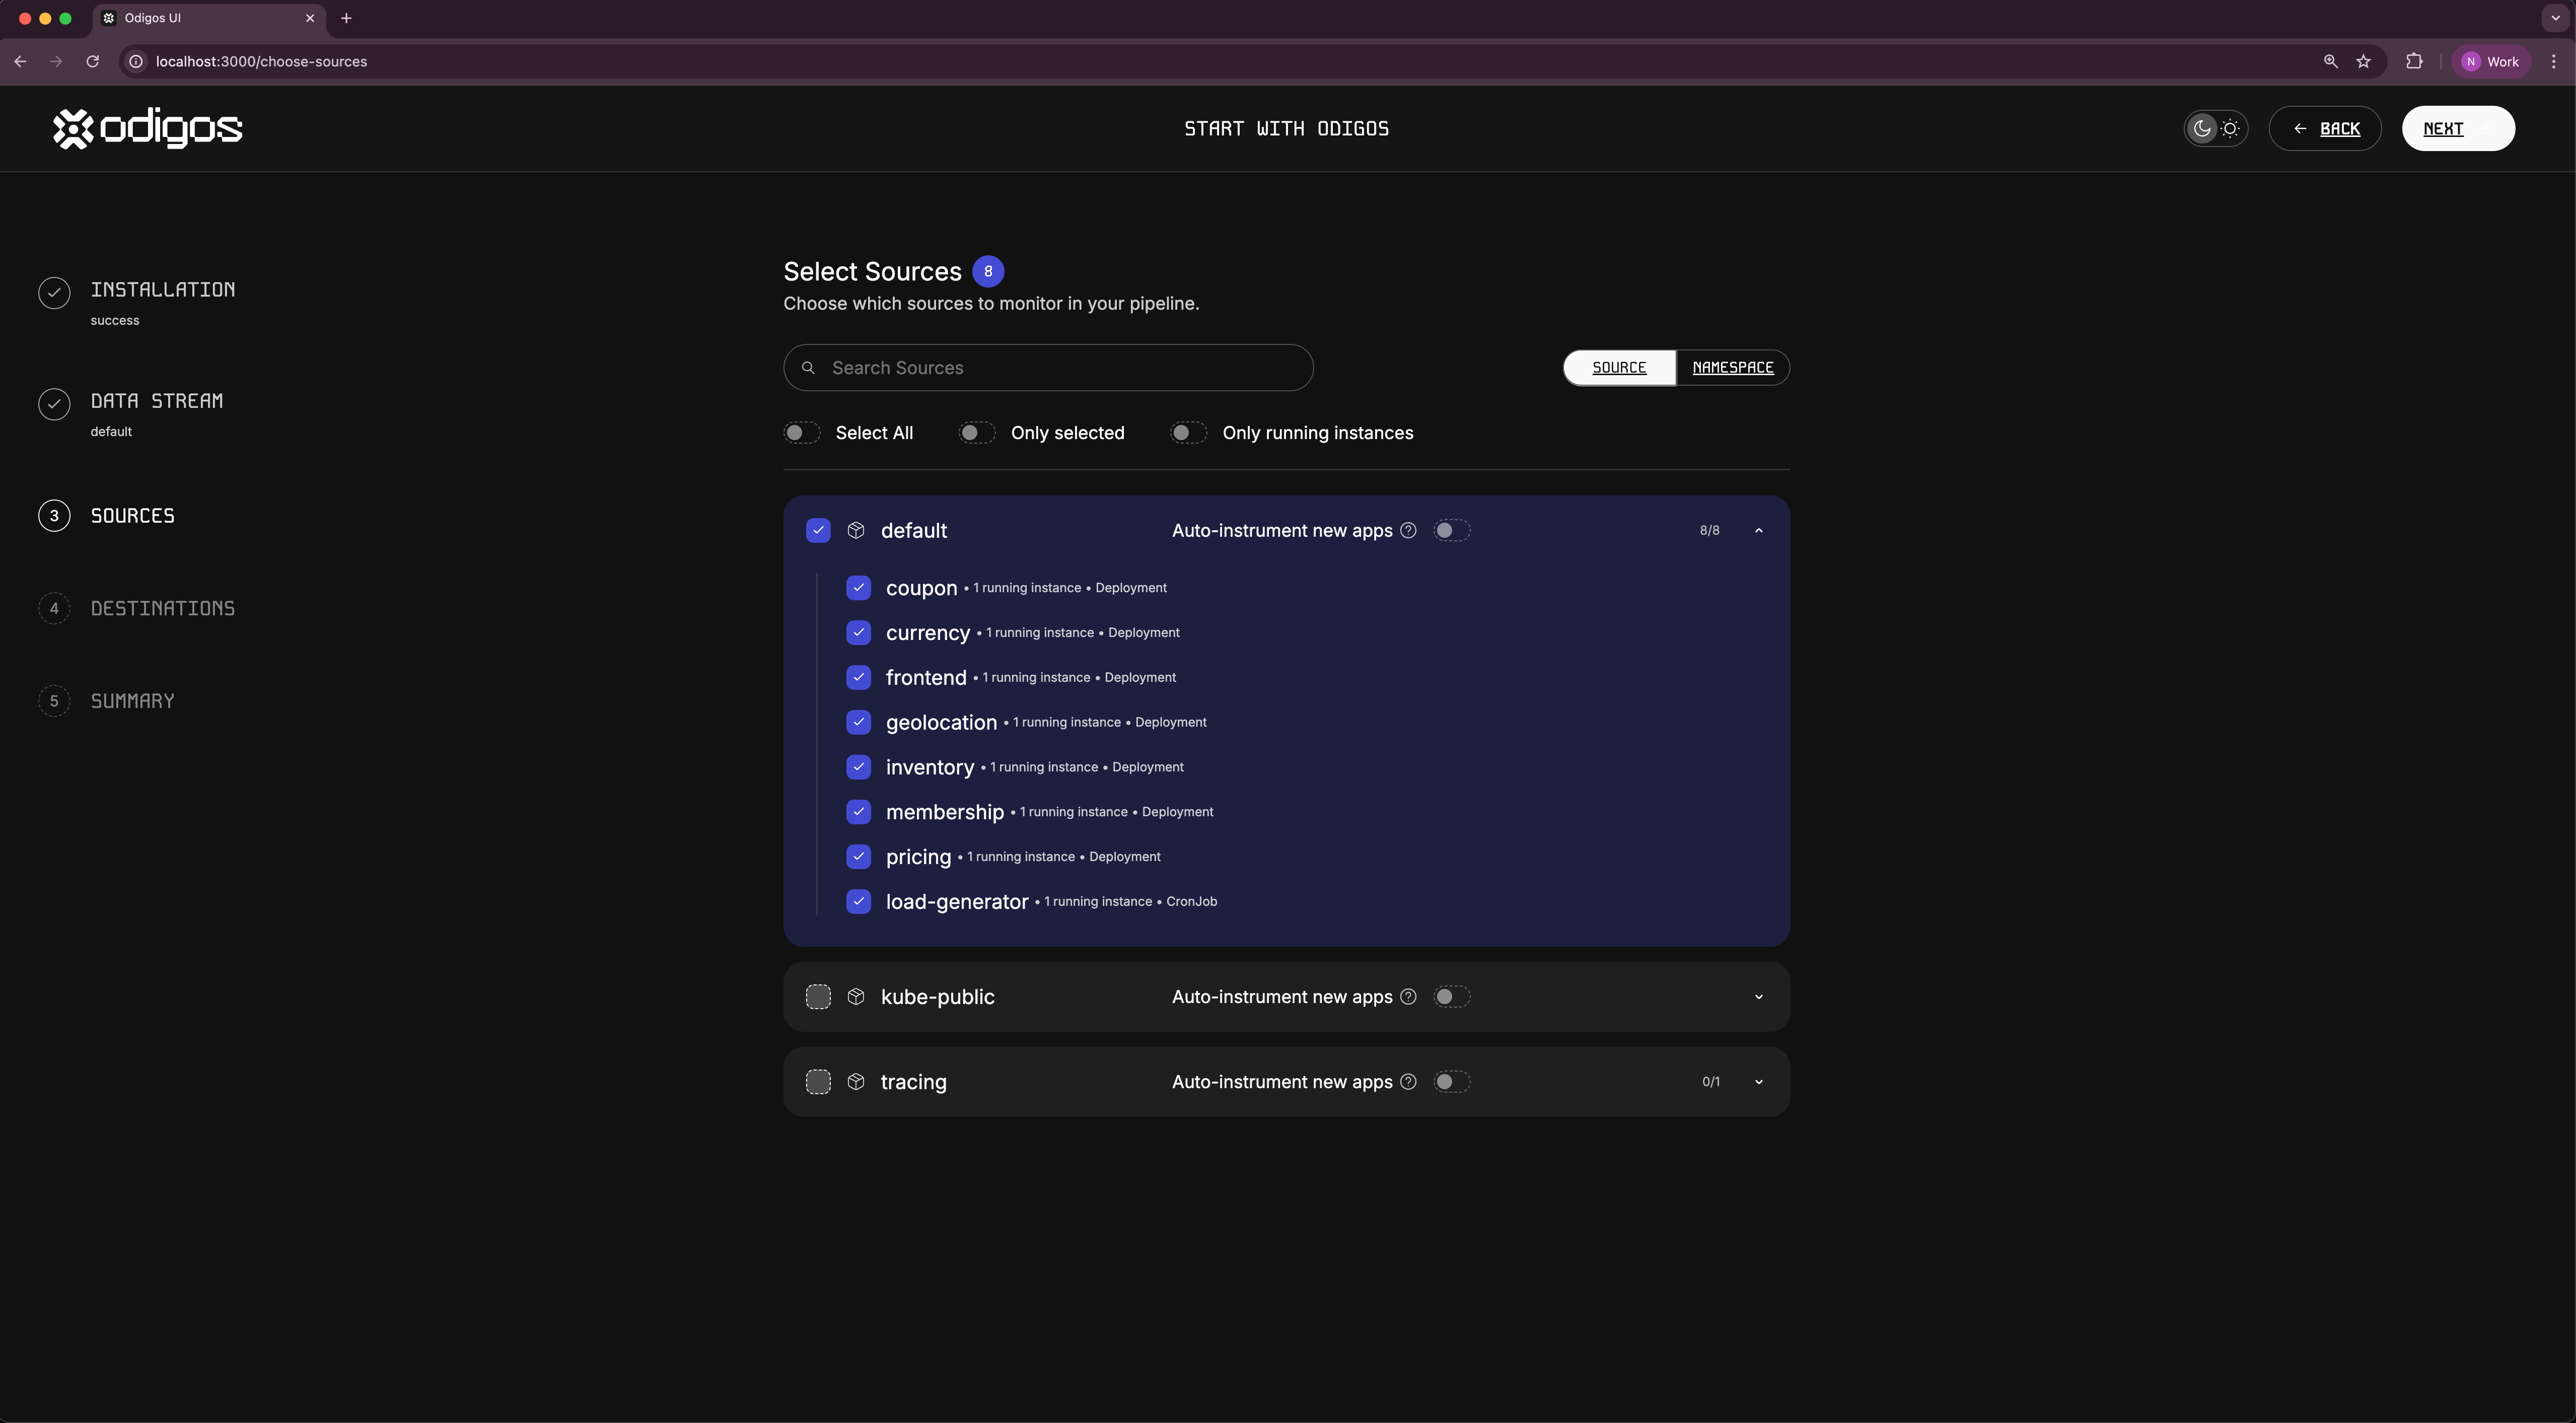 Select all the applications in the `default` namespace and click `Next`.
Selecting **Apply for future apps** will automatically generate distributed traces for any application that will be deployed on that namespace in the future.
## Adding Jaeger as a destination
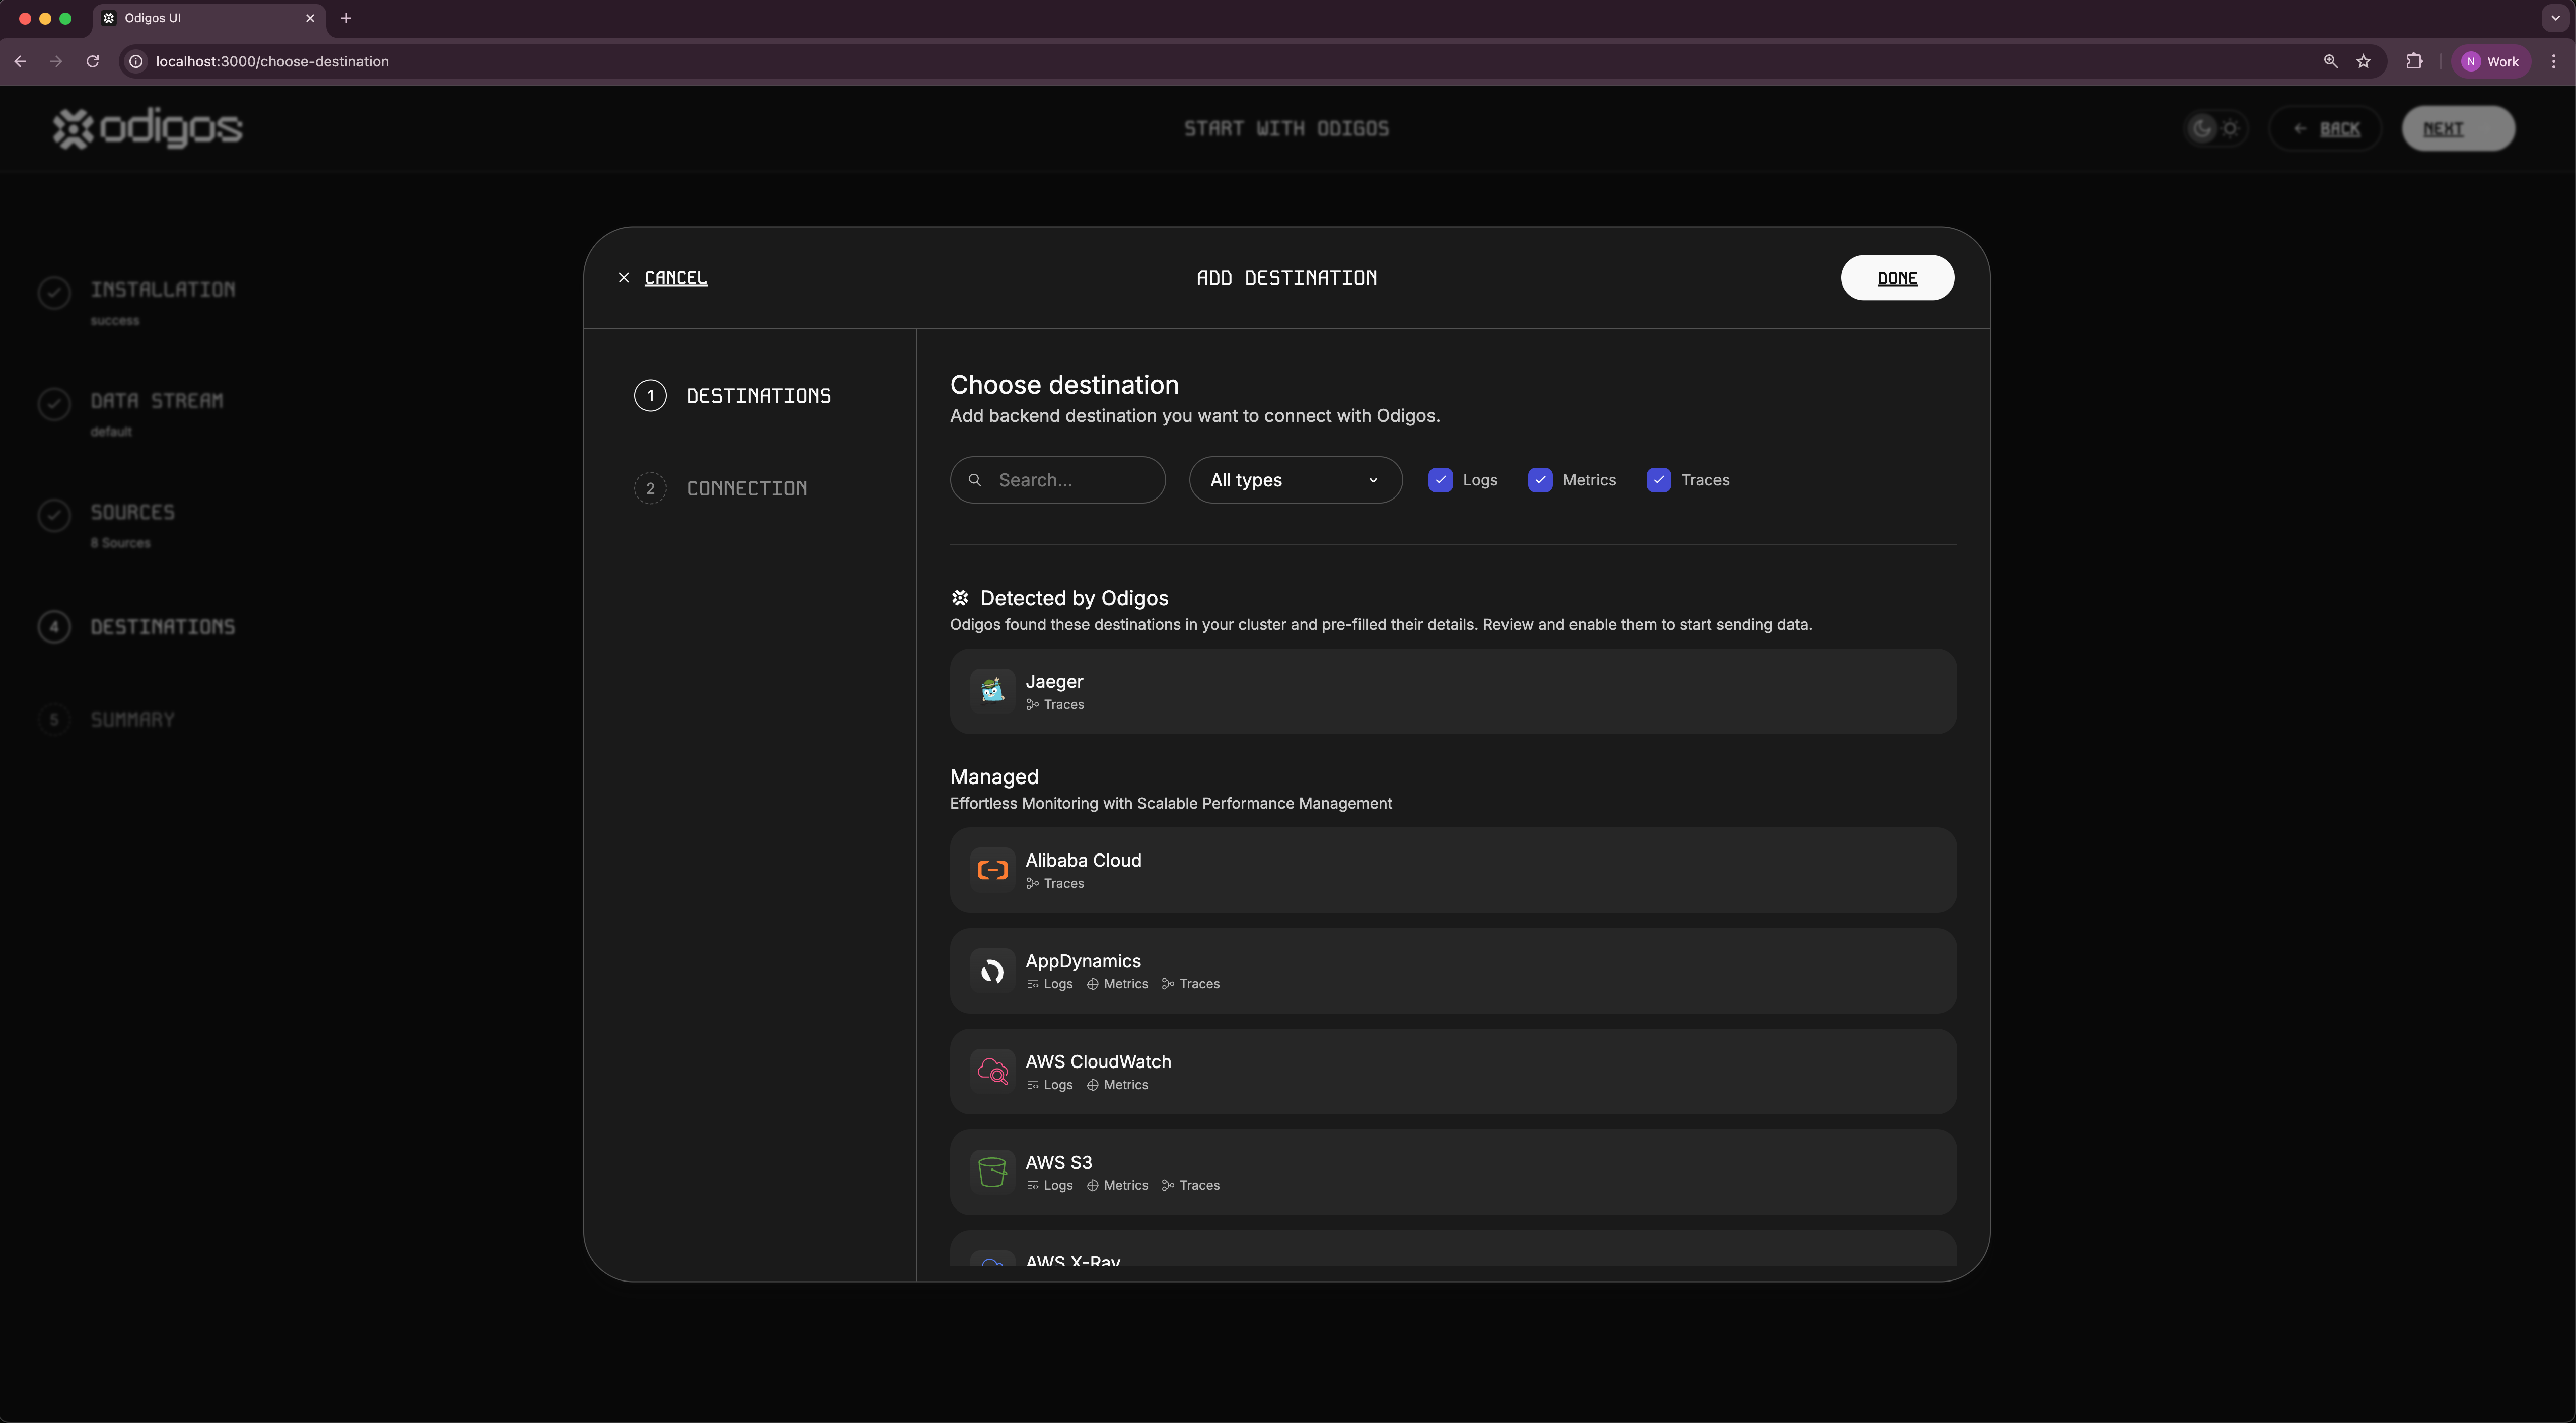
In the next step, you will be asked to select a destination for your traces.
Scroll down to the self hosted destinations and click on **Jaeger**.
Select all the applications in the `default` namespace and click `Next`.
Selecting **Apply for future apps** will automatically generate distributed traces for any application that will be deployed on that namespace in the future.
## Adding Jaeger as a destination
In the next step, you will be asked to select a destination for your traces.
Scroll down to the self hosted destinations and click on **Jaeger**.
 #### Connection details
You will now be asked to provide the connection details for your Jaeger instance:
* **Destination name**: A name for your destination
* **Host**: The hostname of your Jaeger instance.
Enter any name you want for the destination, and enter `jaeger.tracing:4317` as the host.
#### Connection details
You will now be asked to provide the connection details for your Jaeger instance:
* **Destination name**: A name for your destination
* **Host**: The hostname of your Jaeger instance.
Enter any name you want for the destination, and enter `jaeger.tracing:4317` as the host.
 **That's it!** You can now click `Done` and finish the wizard.
Odigos will now instrument your selected applications and deploy the nessesary OpenTelemetry collectors.
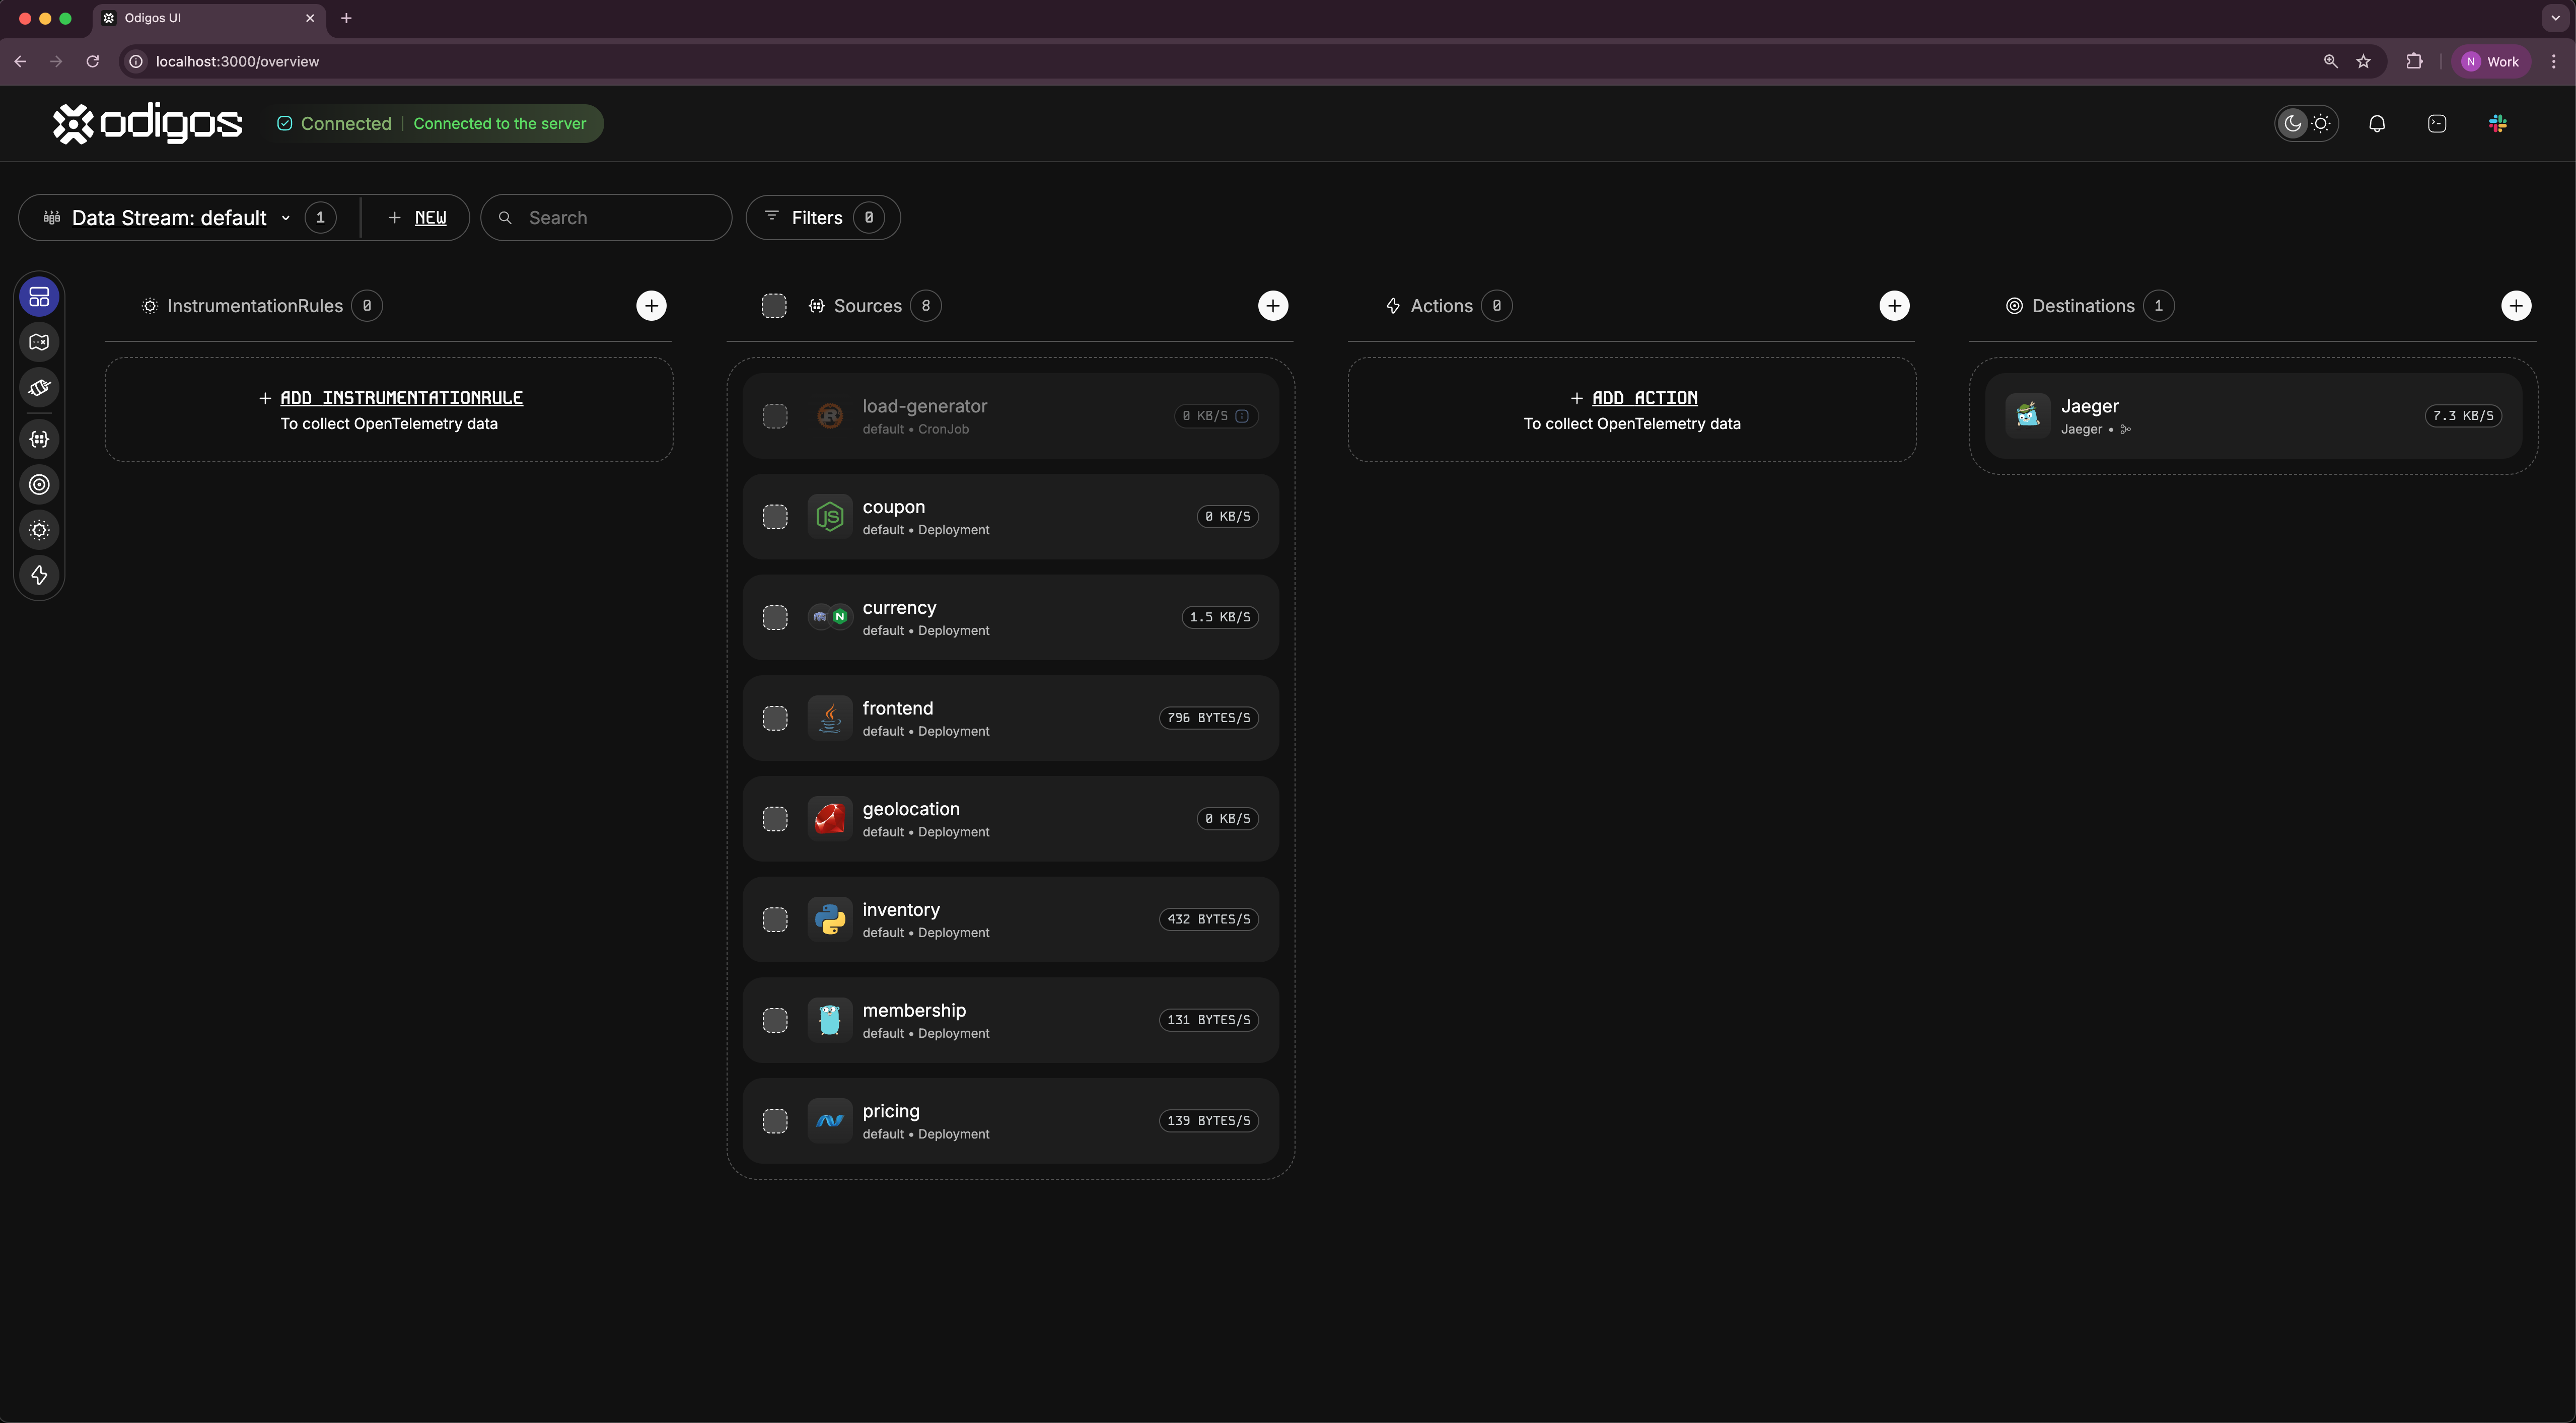
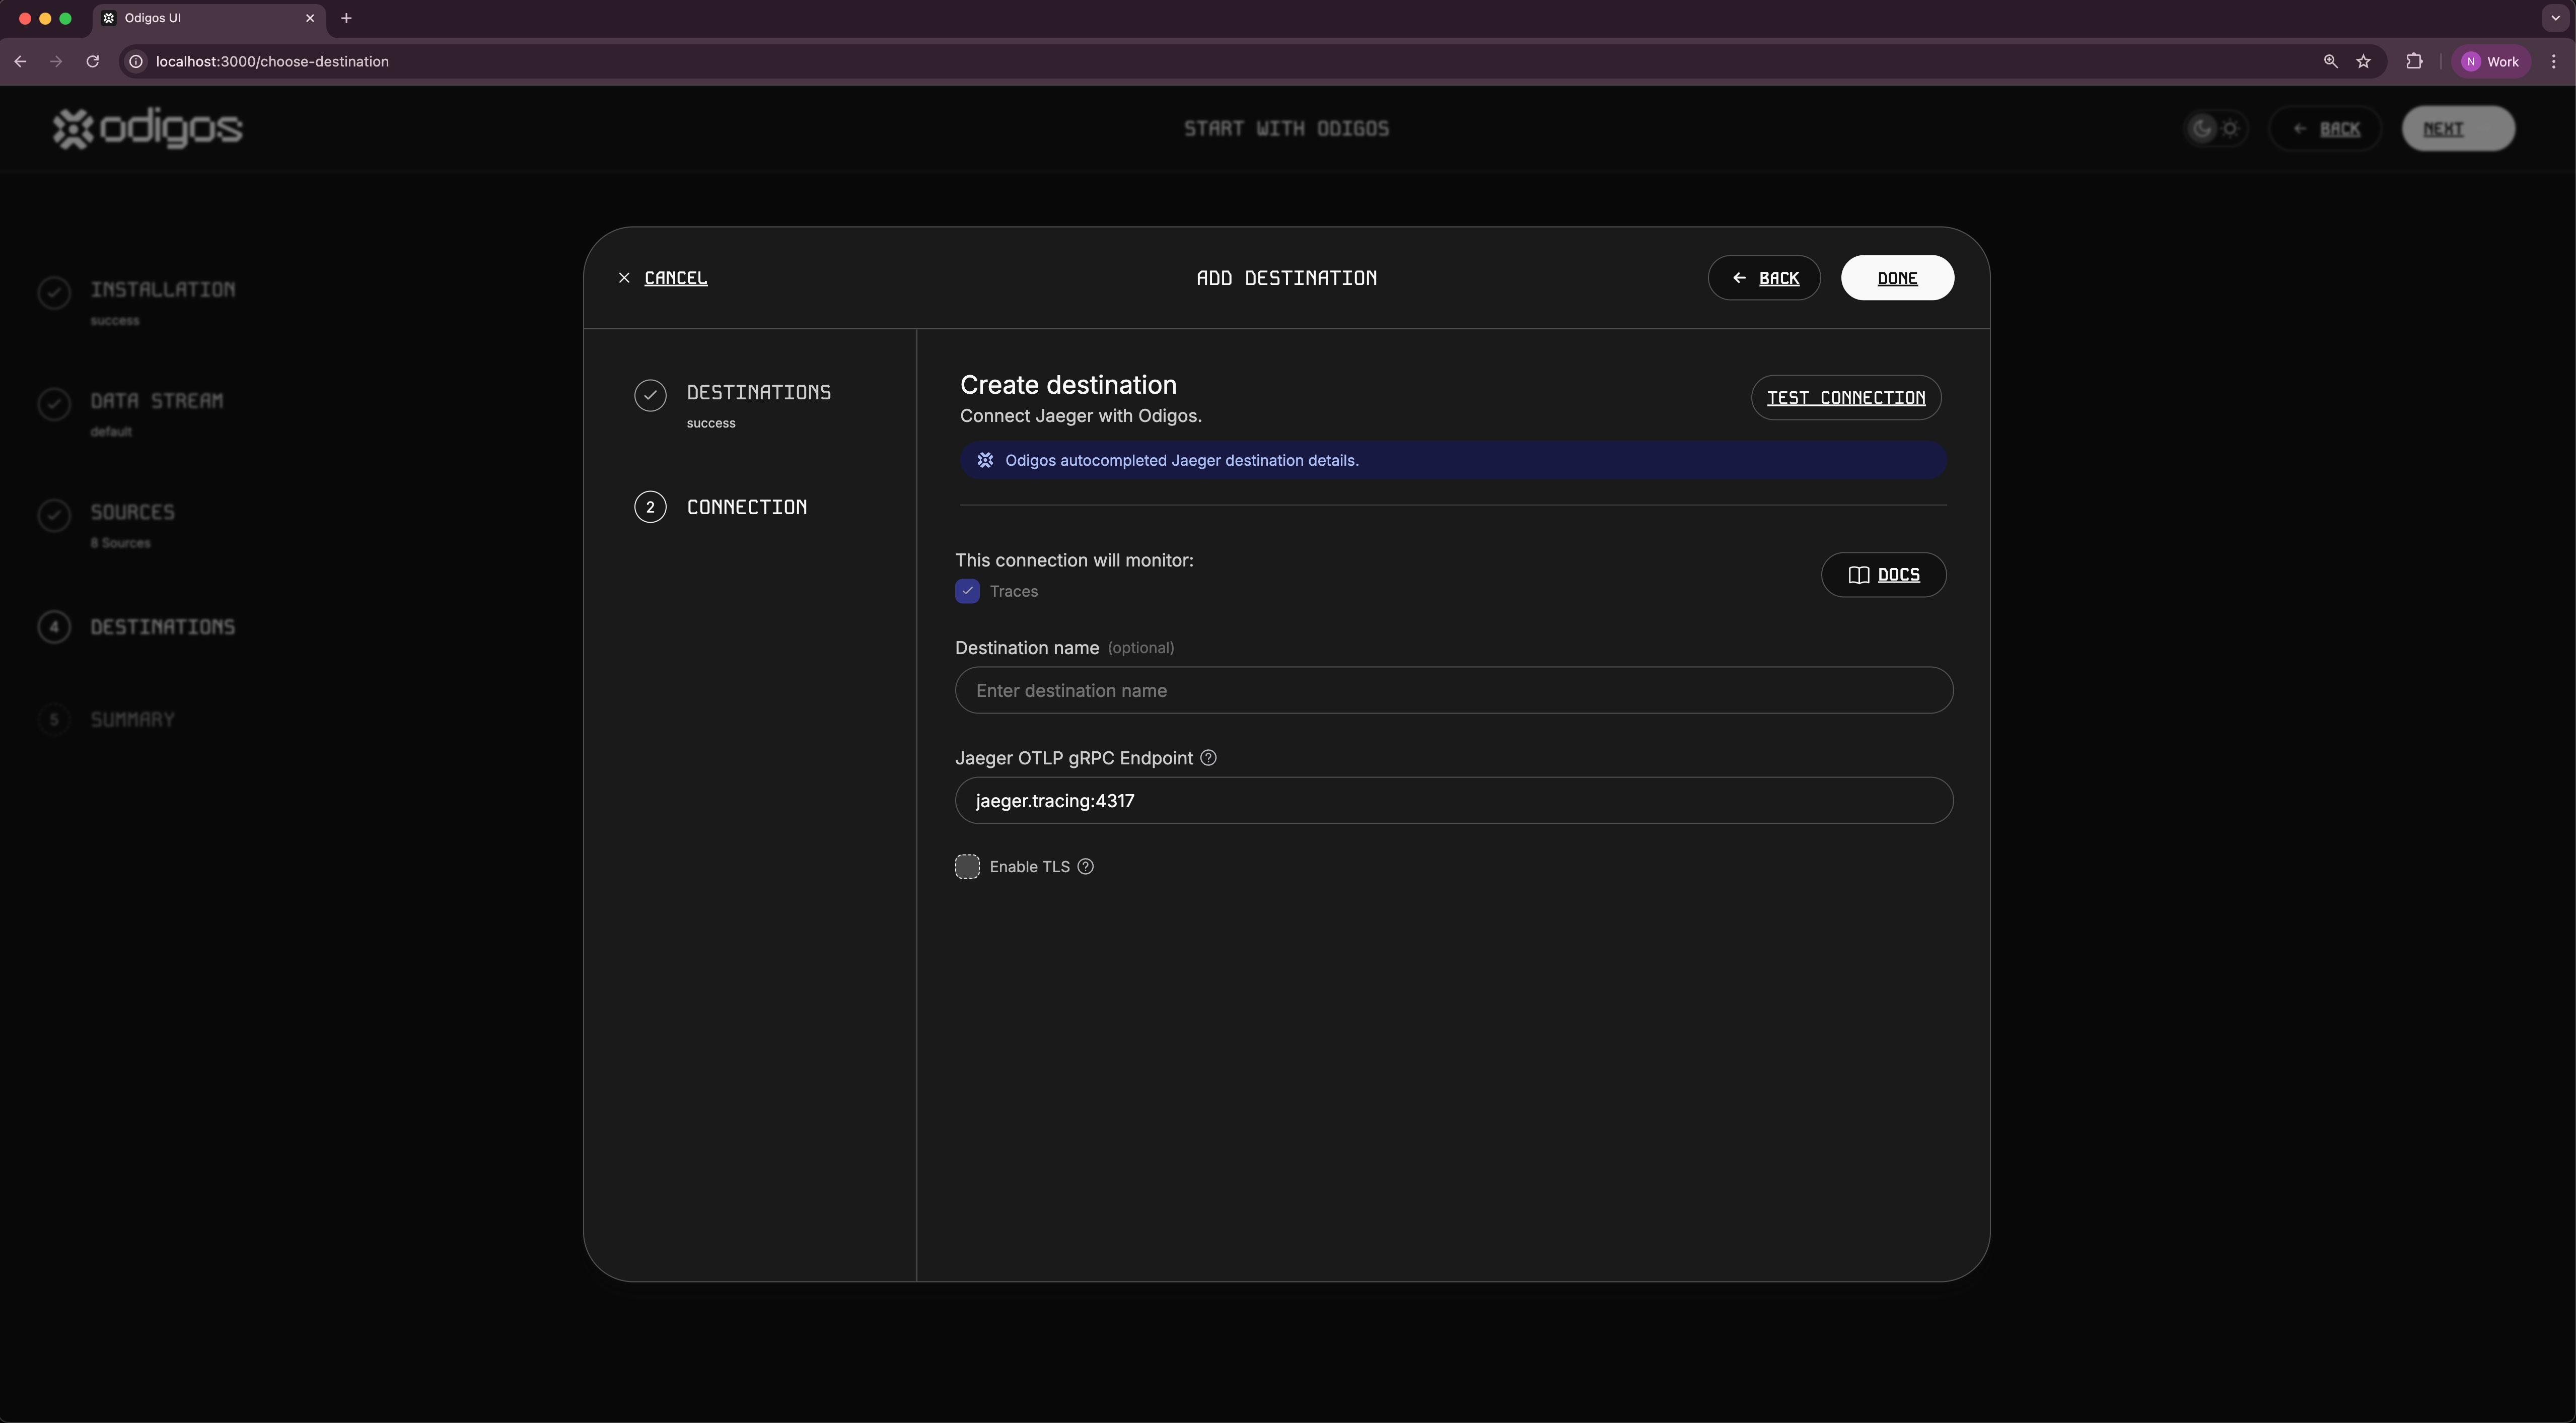
The following page will show an overview of your observability pipeline:
**That's it!** You can now click `Done` and finish the wizard.
Odigos will now instrument your selected applications and deploy the nessesary OpenTelemetry collectors.
The following page will show an overview of your observability pipeline: