> ## Documentation Index
> Fetch the complete documentation index at: https://docs.odigos.io/llms.txt
> Use this file to discover all available pages before exploring further.
# Grafana Cloud Tempo
> Configuring the Grafana Cloud Tempo backend (Managed)
### Getting Started
 These instructions are for the Grafana Cloud **managed** Tempo service. If you run a self hosted Tempo instance, please follow the instructions on the [Tempo](../backends/tempo) page.
You can use Grafana Cloud managed service as a backend for Odigos to store your logs, metrics, and traces. This page describes how to configure Odigos to use Grafana Cloud Tempo as a **trace** backend.
All the connection details can be found at [grafana.com](https://grafana.com) under **My Account**
These instructions are for the Grafana Cloud **managed** Tempo service. If you run a self hosted Tempo instance, please follow the instructions on the [Tempo](../backends/tempo) page.
You can use Grafana Cloud managed service as a backend for Odigos to store your logs, metrics, and traces. This page describes how to configure Odigos to use Grafana Cloud Tempo as a **trace** backend.
All the connection details can be found at [grafana.com](https://grafana.com) under **My Account**
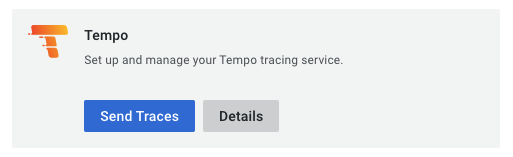
 Then, under the "GRAFANA CLOUD" title, select your Grafana Stuck, browser to the "Tempo" card and click "Send Traces"
 ### Configuring Destination Fields
✅ Traces
❌ Metrics
❌ Logs
❌ Profiles
* **GRAFANA\_CLOUD\_TEMPO\_ENDPOINT** `string` : Endpoint. This is the URL of the Tempo service, in the form of `host:port`. You can find the endpoint under the "Sending data to Tempo" section.
* This field is required
* Example: `tempo-us-central1.grafana.net:443`
* **GRAFANA\_CLOUD\_TEMPO\_USERNAME** `string` : Username. You can find the username in the "Sending data to Tempo" section under the "basic\_auth" yaml field. The username is a number.
* This field is required
* **GRAFANA\_CLOUD\_TEMPO\_PASSWORD** `string` : Password (Api Token). This field is refered to as "password" or "Grafana.com API Token" in the Grafana Cloud UI. You can manage tokens in your "Account Settings" page under the "SECURITY" section in the "Access Policies" page. Make sure your token scope includes `traces:write` scope.
* This field is required
* Example: `glc_eyJvIj...`
### Adding Destination to Odigos
There are two primary methods for configuring destinations in Odigos:
##### **Using the UI**
Use the [Odigos CLI](https://docs.odigos.io/cli/odigos_ui) to access the UI
```bash theme={null}
odigos ui
```
Click on `Add Destination`, select `Grafana Cloud Tempo` and follow the on-screen instructions
##### **Using Kubernetes manifests**
Save the YAML below to a file (e.g. `grafanacloudtempo.yaml`)
```yaml theme={null}
apiVersion: odigos.io/v1alpha1
kind: Destination
metadata:
name: grafanacloudtempo-example
namespace: odigos-system
spec:
data:
GRAFANA_CLOUD_TEMPO_ENDPOINT:
GRAFANA_CLOUD_TEMPO_USERNAME:
destinationName: grafanacloudtempo
secretRef:
name: grafanacloudtempo-secret
signals:
- TRACES
type: grafanacloudtempo
---
apiVersion: v1
data:
GRAFANA_CLOUD_TEMPO_PASSWORD:
kind: Secret
metadata:
name: grafanacloudtempo-secret
namespace: odigos-system
type: Opaque
```
Apply the YAML using `kubectl`
```bash theme={null}
kubectl apply -f grafanacloudtempo.yaml
```
### Configuring Destination Fields
✅ Traces
❌ Metrics
❌ Logs
❌ Profiles
* **GRAFANA\_CLOUD\_TEMPO\_ENDPOINT** `string` : Endpoint. This is the URL of the Tempo service, in the form of `host:port`. You can find the endpoint under the "Sending data to Tempo" section.
* This field is required
* Example: `tempo-us-central1.grafana.net:443`
* **GRAFANA\_CLOUD\_TEMPO\_USERNAME** `string` : Username. You can find the username in the "Sending data to Tempo" section under the "basic\_auth" yaml field. The username is a number.
* This field is required
* **GRAFANA\_CLOUD\_TEMPO\_PASSWORD** `string` : Password (Api Token). This field is refered to as "password" or "Grafana.com API Token" in the Grafana Cloud UI. You can manage tokens in your "Account Settings" page under the "SECURITY" section in the "Access Policies" page. Make sure your token scope includes `traces:write` scope.
* This field is required
* Example: `glc_eyJvIj...`
### Adding Destination to Odigos
There are two primary methods for configuring destinations in Odigos:
##### **Using the UI**
Use the [Odigos CLI](https://docs.odigos.io/cli/odigos_ui) to access the UI
```bash theme={null}
odigos ui
```
Click on `Add Destination`, select `Grafana Cloud Tempo` and follow the on-screen instructions
##### **Using Kubernetes manifests**
Save the YAML below to a file (e.g. `grafanacloudtempo.yaml`)
```yaml theme={null}
apiVersion: odigos.io/v1alpha1
kind: Destination
metadata:
name: grafanacloudtempo-example
namespace: odigos-system
spec:
data:
GRAFANA_CLOUD_TEMPO_ENDPOINT:
GRAFANA_CLOUD_TEMPO_USERNAME:
destinationName: grafanacloudtempo
secretRef:
name: grafanacloudtempo-secret
signals:
- TRACES
type: grafanacloudtempo
---
apiVersion: v1
data:
GRAFANA_CLOUD_TEMPO_PASSWORD:
kind: Secret
metadata:
name: grafanacloudtempo-secret
namespace: odigos-system
type: Opaque
```
Apply the YAML using `kubectl`
```bash theme={null}
kubectl apply -f grafanacloudtempo.yaml
```