> ## Documentation Index
> Fetch the complete documentation index at: https://docs.odigos.io/llms.txt
> Use this file to discover all available pages before exploring further.
# View profiles in odictl
> Open, navigate, and inspect continuous CPU profiles directly in the odictl terminal interface.
`odictl` includes a built-in profiling view so you can inspect continuous CPU profiles directly in the terminal—without opening an external backend. Use it to find the functions consuming the most CPU in a service, and to drive [profile-driven custom instrumentation](../../setup/configuration/instrumentation-rules/instrument-from-profiles).
## Prerequisites
* VM Agent installed and running ([Installation](../../setup/installation)).
* At least one [source](../../setup/configuration/add-sources) enabled for the workloads you want to profile.
* The profiling pipeline enabled. You can enable it ahead of time (see [Getting started](./getting-started) or the Configuration Editor's **Profiling** section in [odictl](../../setup/configuration/odictl)), or directly from the profiling view as described below.
## Open the profiling view
From the main `odictl` dashboard, press Shift+P to open the profiling view.
If profiling is not yet enabled, `odictl` shows an **Odigos profiling is not enabled** prompt. Press Enter to enable it.
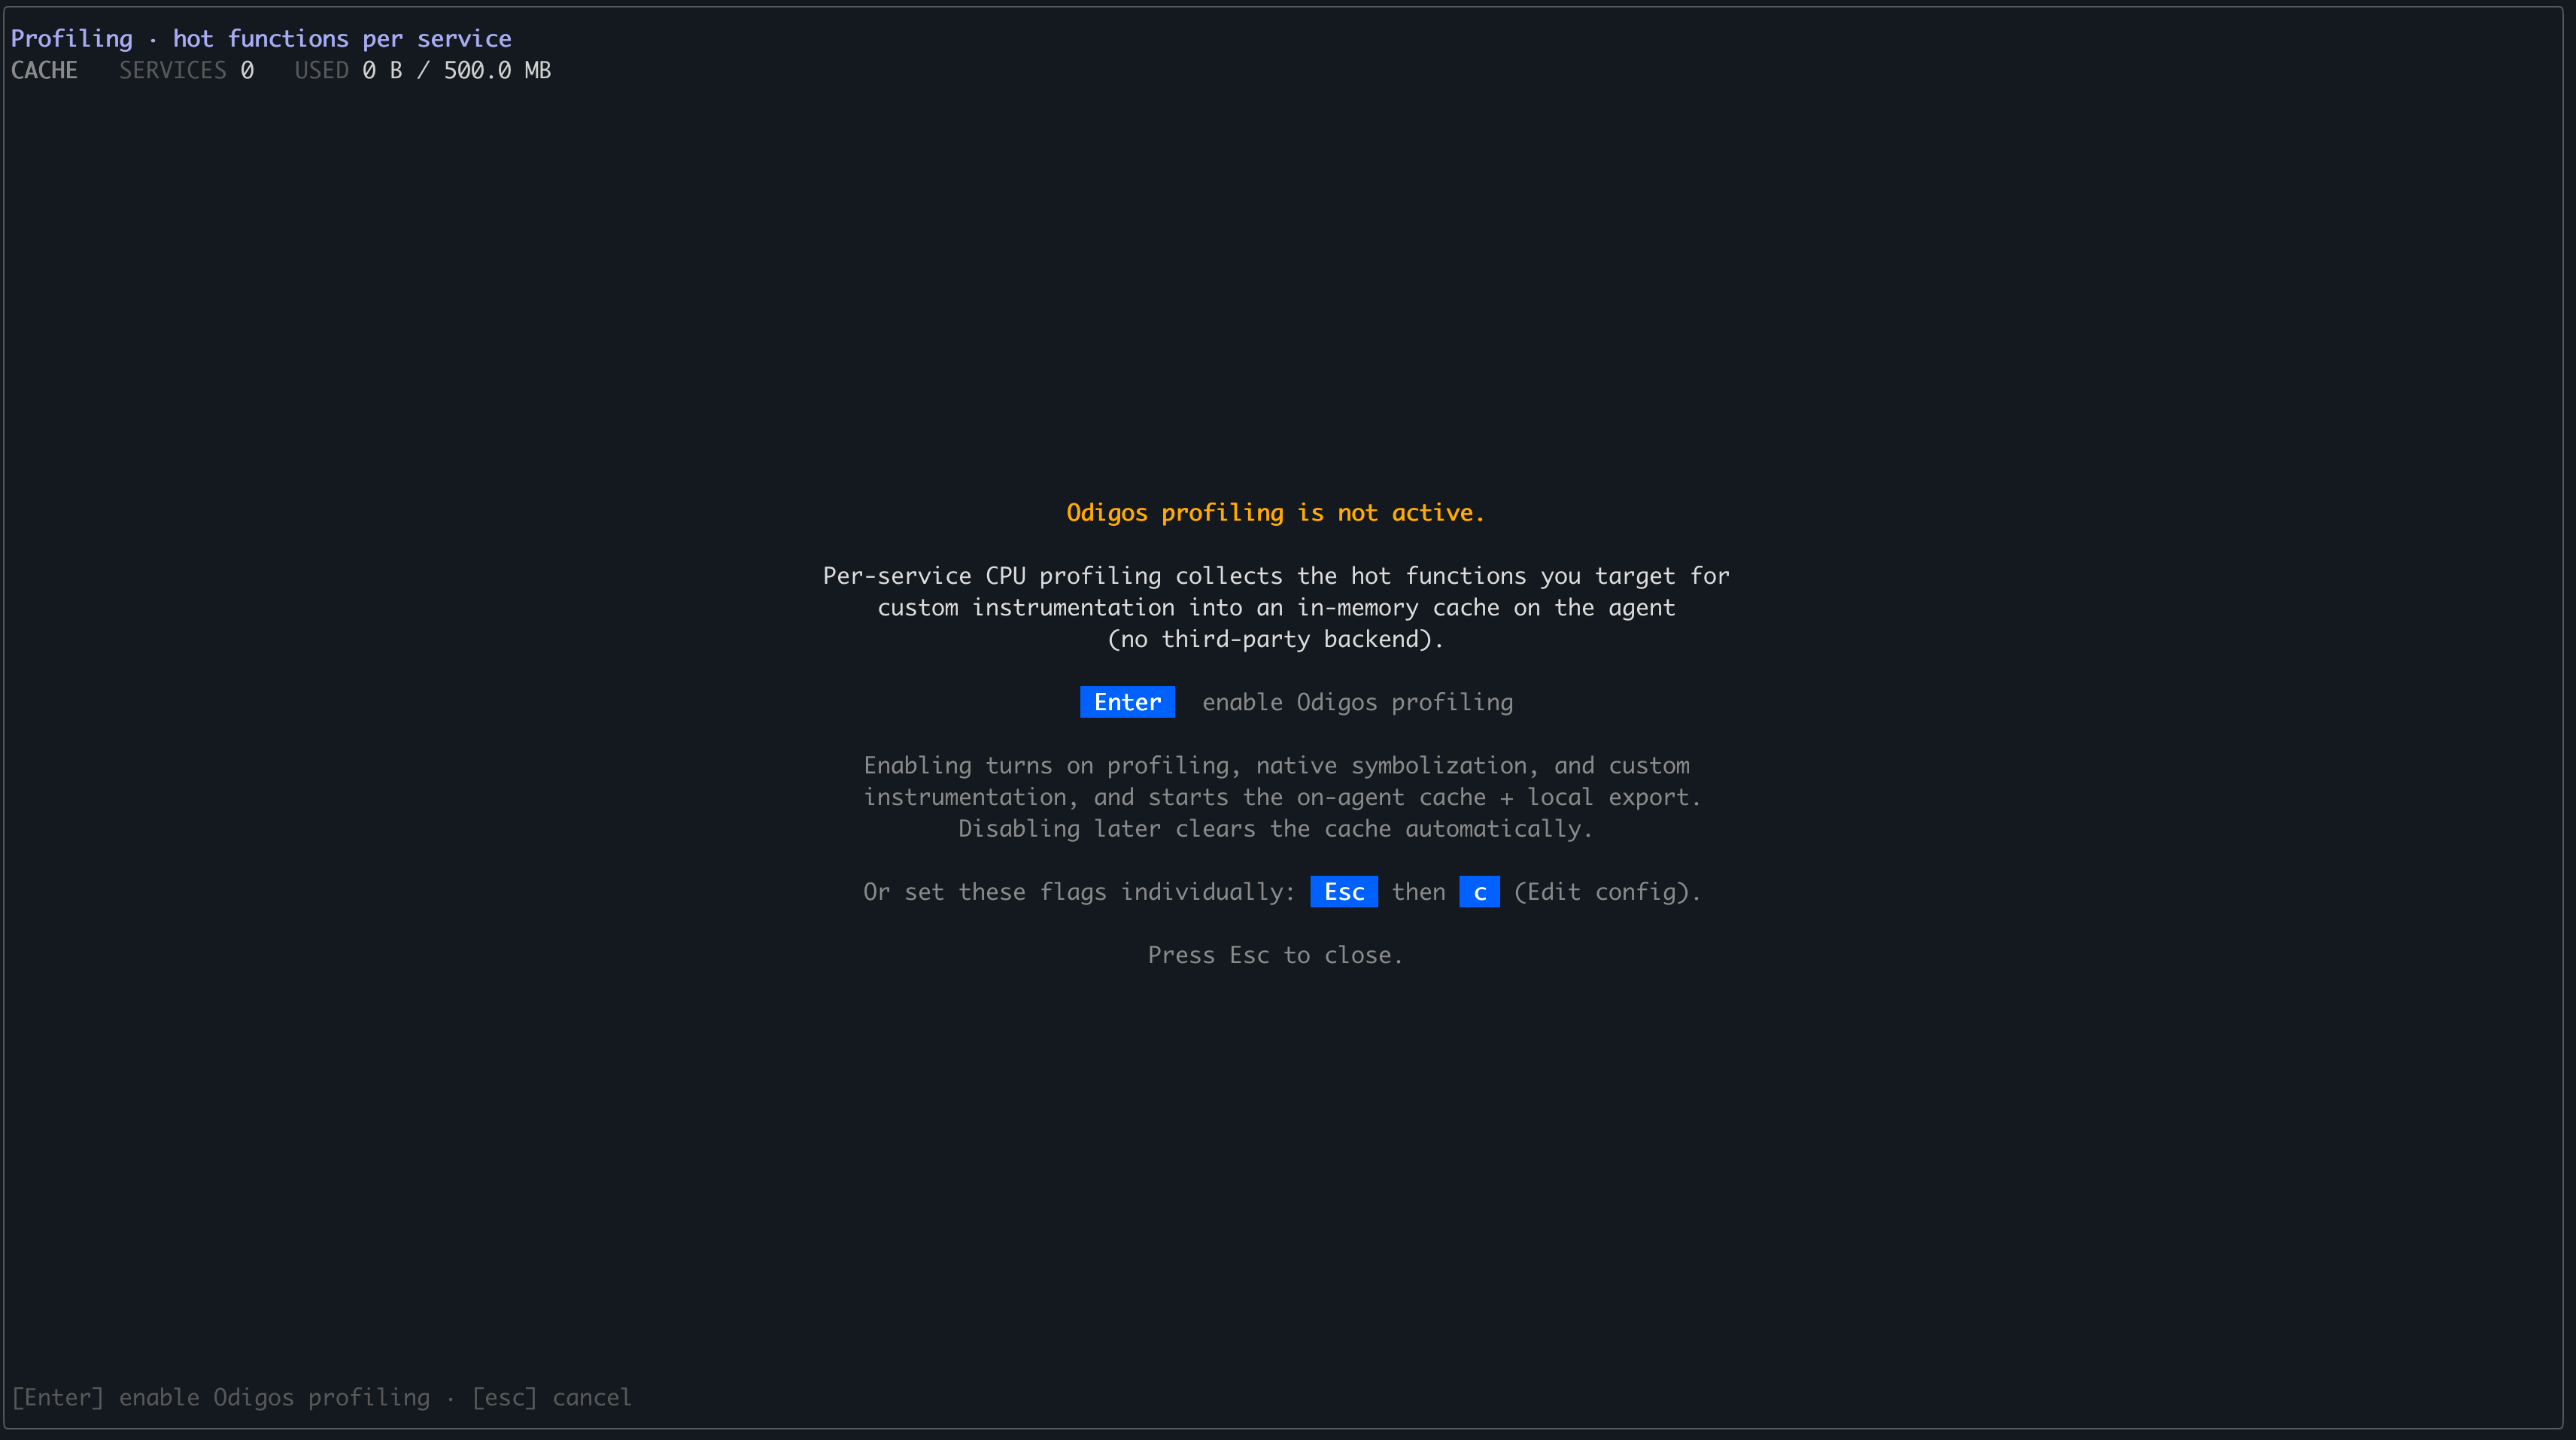 You can also enable profiling without opening this view by setting **profiling.enabled** in the Configuration Editor. See [Getting started](./getting-started) for the full setup.
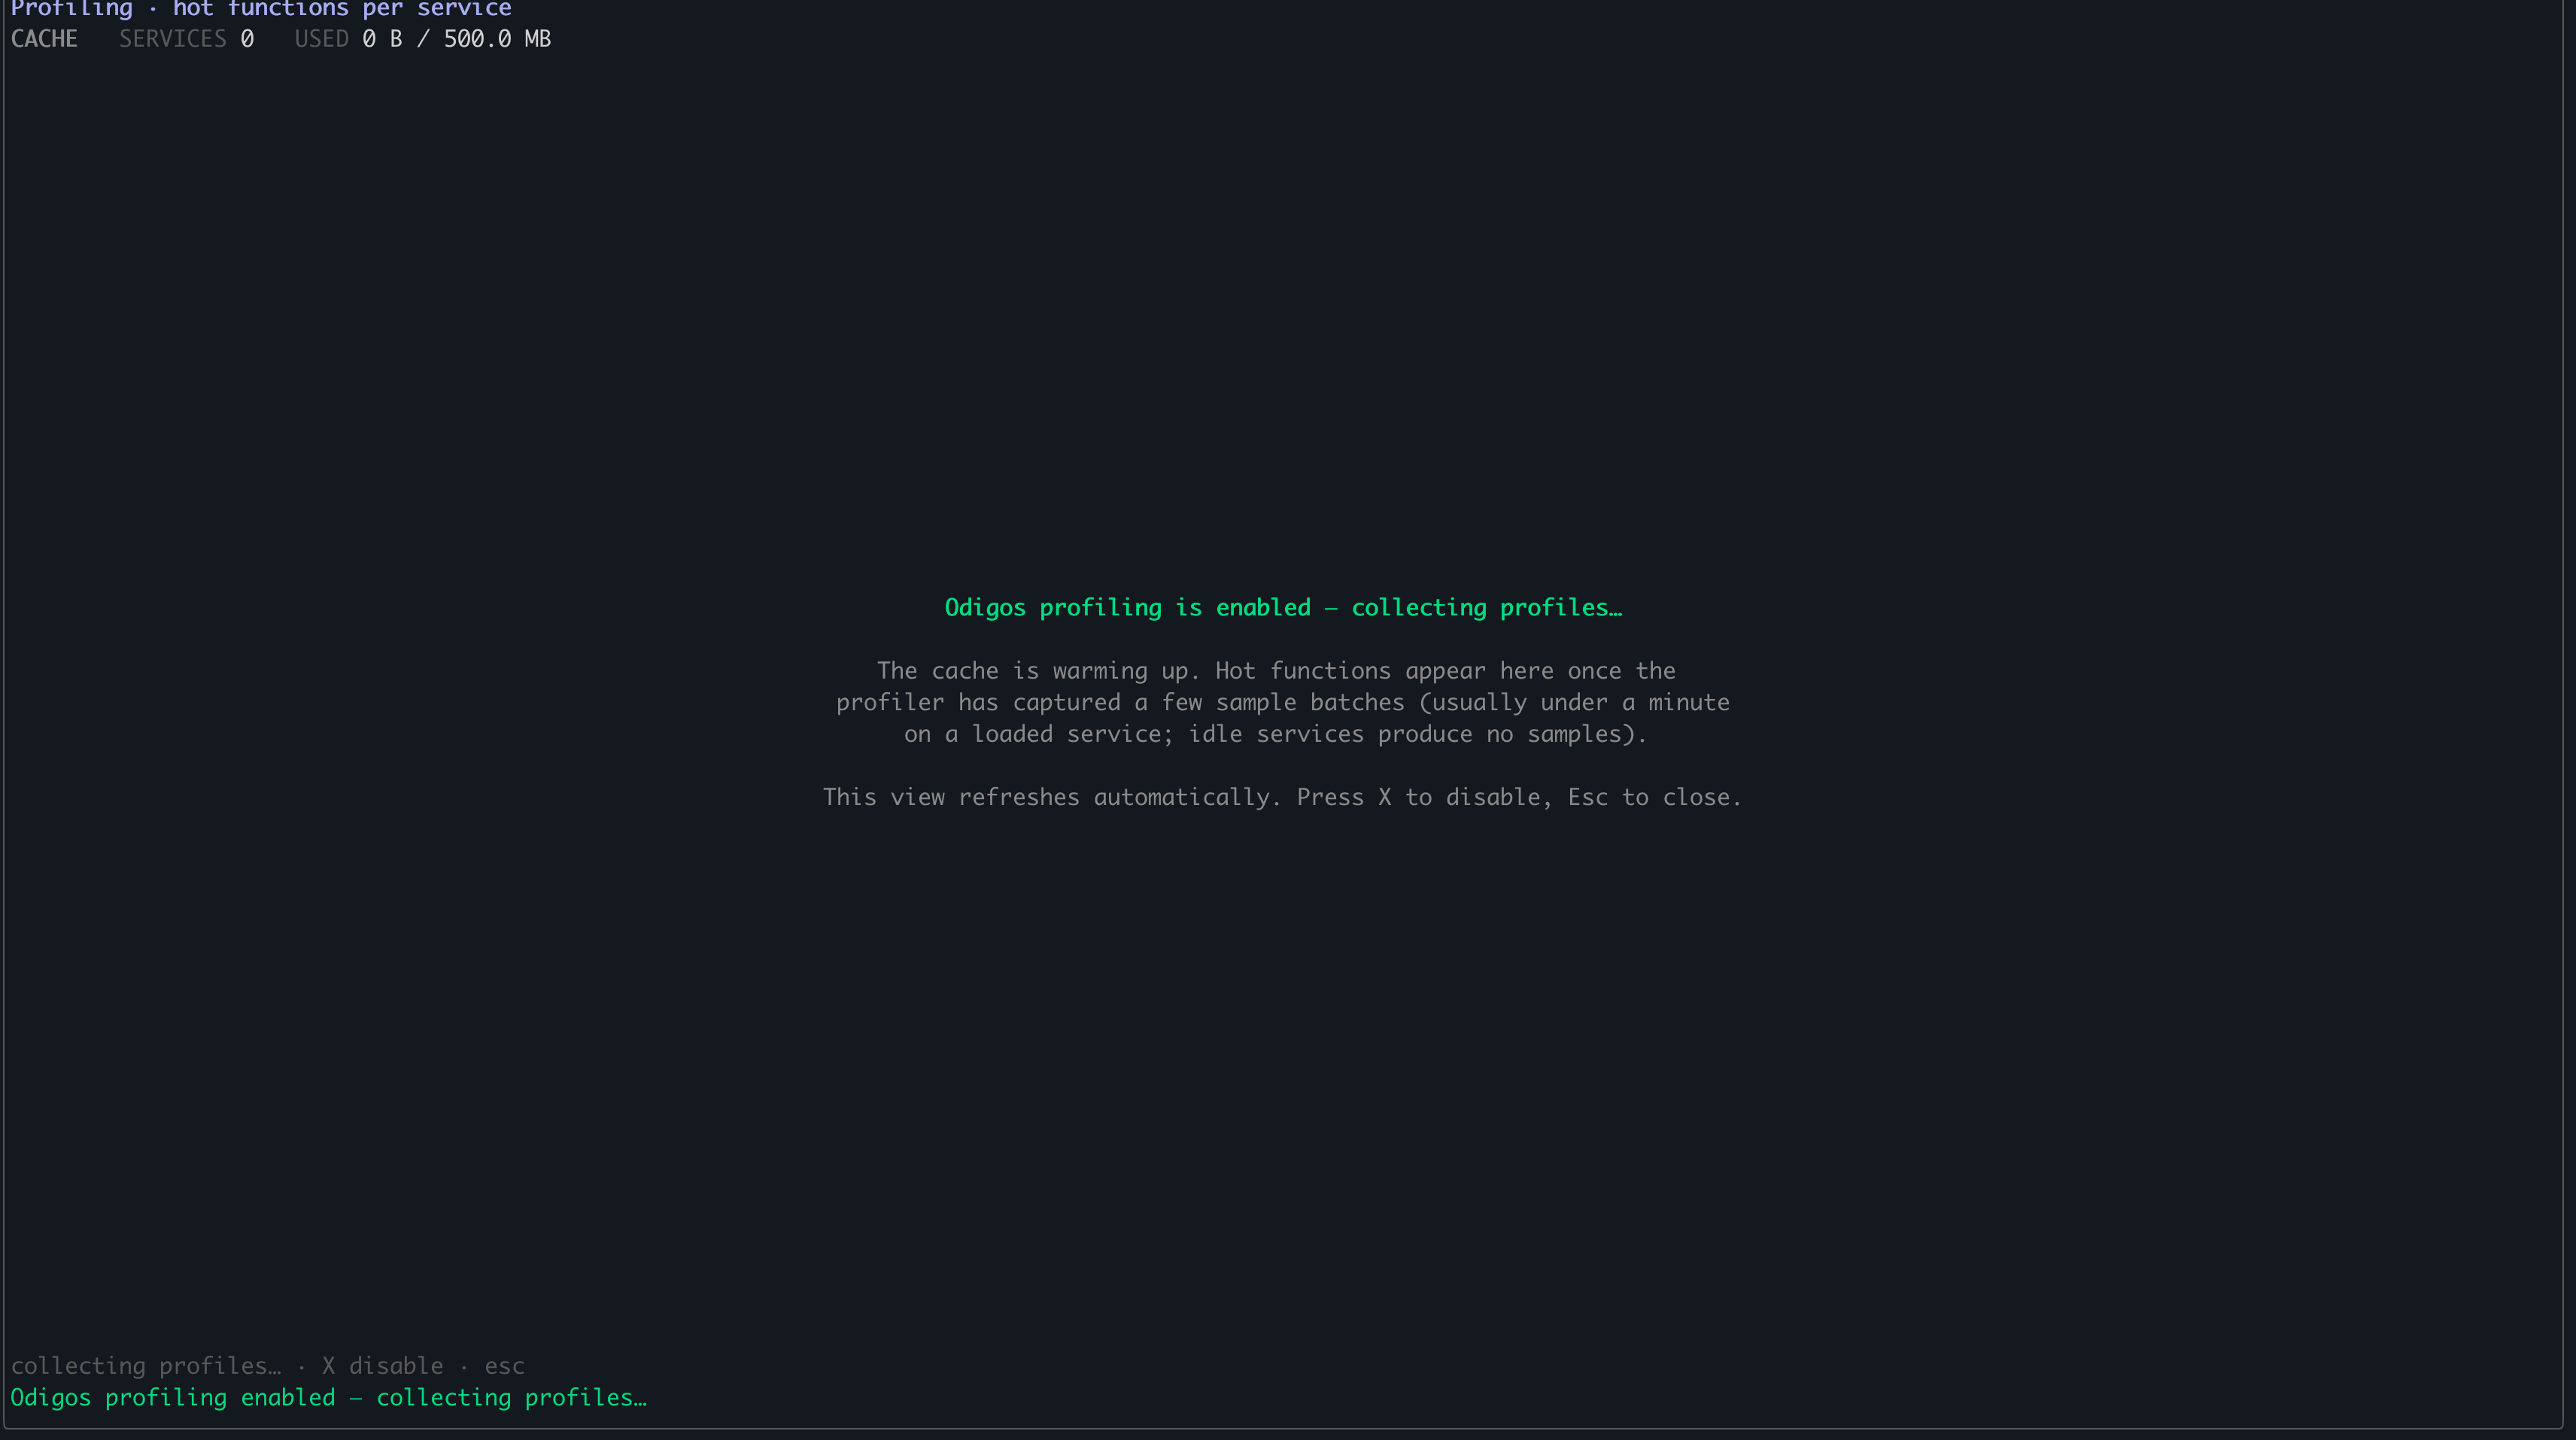
After profiling is enabled, the agent collects samples before any data appears. This can take up to a minute.
The first load may be empty while samples are gathered. Wait a few moments and the services and functions populate automatically—no restart is needed.
You can also enable profiling without opening this view by setting **profiling.enabled** in the Configuration Editor. See [Getting started](./getting-started) for the full setup.
After profiling is enabled, the agent collects samples before any data appears. This can take up to a minute.
The first load may be empty while samples are gathered. Wait a few moments and the services and functions populate automatically—no restart is needed.
 ## Navigating the profiling view
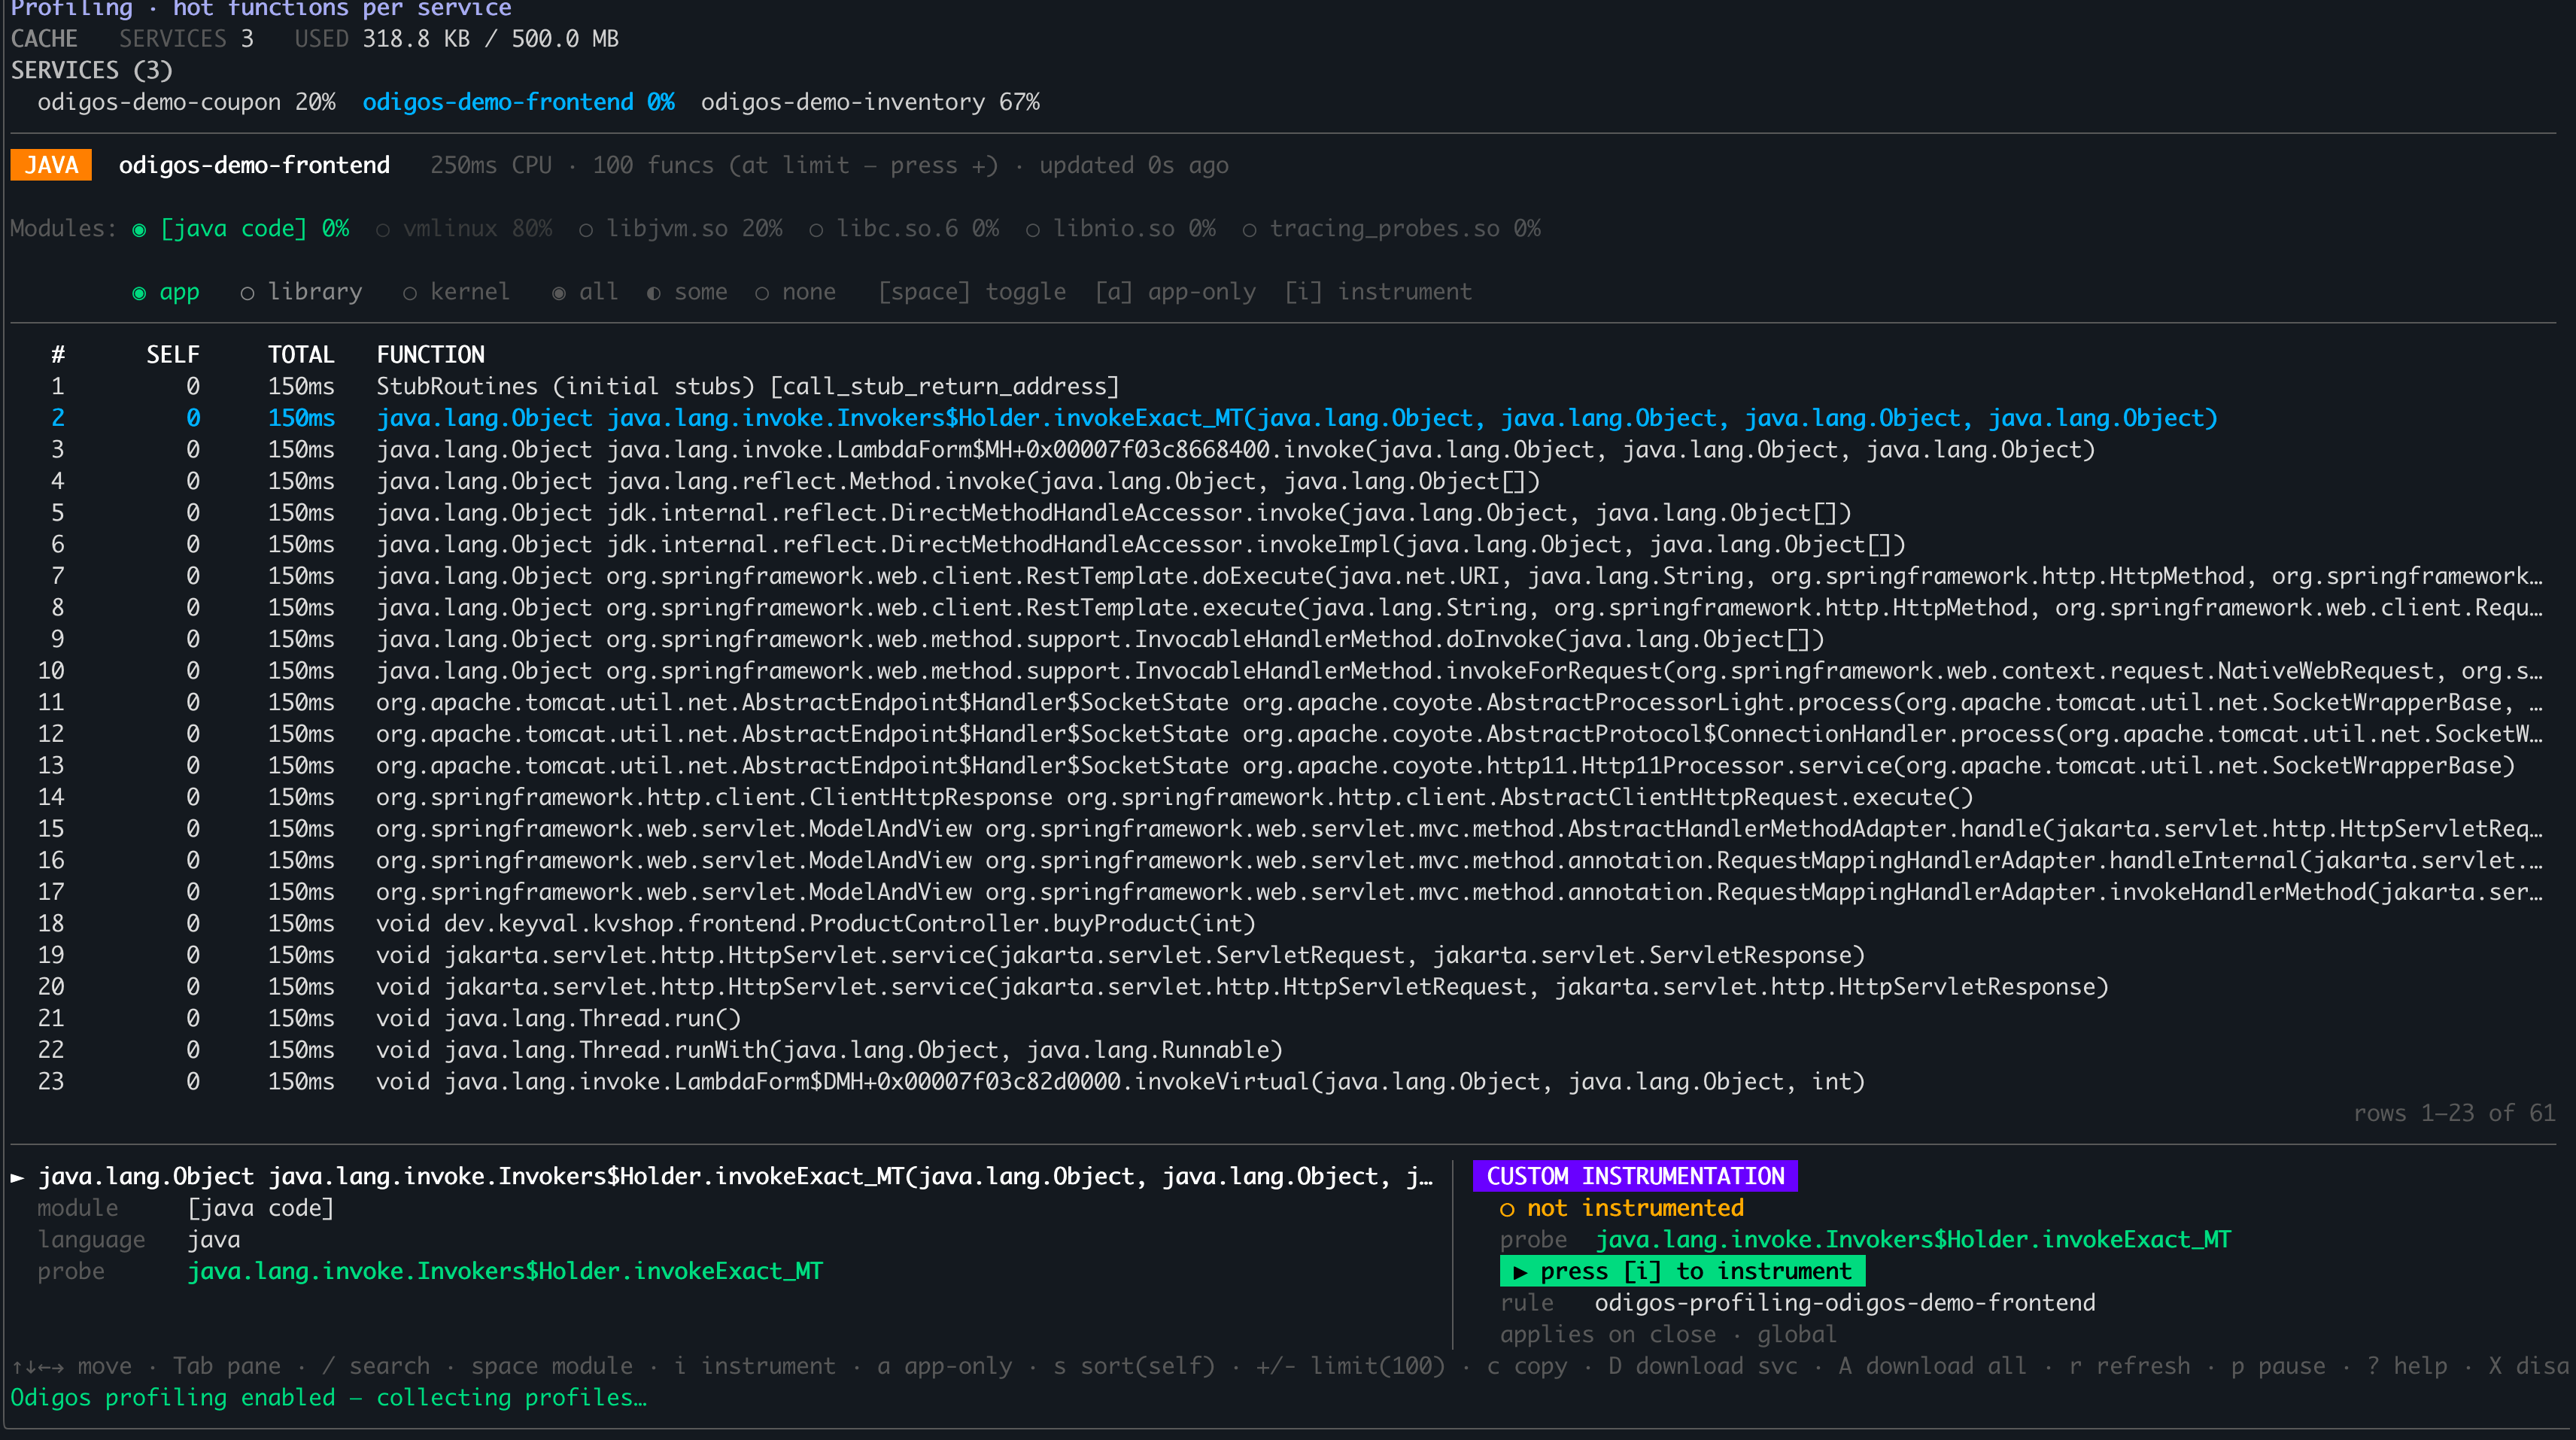
The profiling view has three panes: a **Services** list on the left, a **Filter modules** bar across the top, and a **Functions** list. Use `Tab` to move between them and the arrow keys to move within the focused pane.
| Key | Action |
| --------- | ------------------------------------------------------------------- |
| `Shift+P` | Open the profiling view from the dashboard |
| `Tab` | Cycle between the Services, Filter modules, and Functions panes |
| `↑` / `↓` | Move between items in the focused pane |
| `Space` | Toggle the highlighted module in the Filter modules pane |
| `a` | Show app-only functions |
| `i` | Instrument the highlighted function (or remove its instrumentation) |
| `Esc` | Return to the main dashboard |
Mouse selection is not supported in the profiling view. Use the arrow keys to select items and `Tab` to switch panes.
### Services pane
The left pane lists the services that have profile data. Use the arrow keys to highlight the service you want to inspect.
### Filter modules
Press `Tab` to focus the **Filter modules** bar at the top. It controls which modules and sample types appear in the Functions list:
* **Module** — selects which modules to show in the profile. This is set based on the language of the selected service (for example, Java). You can also choose `vmlinux` or other libraries based on the runtime/language. Press `Space` to toggle the highlighted module.
* **Type** — defaults to `app`. You can also select `library` or `kernel`, or press `a` to show app-only functions.
## Navigating the profiling view
The profiling view has three panes: a **Services** list on the left, a **Filter modules** bar across the top, and a **Functions** list. Use `Tab` to move between them and the arrow keys to move within the focused pane.
| Key | Action |
| --------- | ------------------------------------------------------------------- |
| `Shift+P` | Open the profiling view from the dashboard |
| `Tab` | Cycle between the Services, Filter modules, and Functions panes |
| `↑` / `↓` | Move between items in the focused pane |
| `Space` | Toggle the highlighted module in the Filter modules pane |
| `a` | Show app-only functions |
| `i` | Instrument the highlighted function (or remove its instrumentation) |
| `Esc` | Return to the main dashboard |
Mouse selection is not supported in the profiling view. Use the arrow keys to select items and `Tab` to switch panes.
### Services pane
The left pane lists the services that have profile data. Use the arrow keys to highlight the service you want to inspect.
### Filter modules
Press `Tab` to focus the **Filter modules** bar at the top. It controls which modules and sample types appear in the Functions list:
* **Module** — selects which modules to show in the profile. This is set based on the language of the selected service (for example, Java). You can also choose `vmlinux` or other libraries based on the runtime/language. Press `Space` to toggle the highlighted module.
* **Type** — defaults to `app`. You can also select `library` or `kernel`, or press `a` to show app-only functions.
 ### Functions pane
Press `Tab` again to focus the list of profiled functions for the selected service and filter. Use the arrow keys to highlight a function. From here, press `i` to instrument the highlighted function (the panel then shows **\[i] remove** to undo it)—see [Instrument from Profiles](../../setup/configuration/instrumentation-rules/instrument-from-profiles) for the full workflow.
## Getting Help
If you have any issues, or require our assistance, please open an issue in [GitHub](https://github.com/odigos-io/odigos), or reach out to us in [Odigos Slack](https://join.slack.com/t/odigos/shared_invite/zt-24u91yknm-0fLXu6qnqYfNHS_GSUgTJw)
### Functions pane
Press `Tab` again to focus the list of profiled functions for the selected service and filter. Use the arrow keys to highlight a function. From here, press `i` to instrument the highlighted function (the panel then shows **\[i] remove** to undo it)—see [Instrument from Profiles](../../setup/configuration/instrumentation-rules/instrument-from-profiles) for the full workflow.
## Getting Help
If you have any issues, or require our assistance, please open an issue in [GitHub](https://github.com/odigos-io/odigos), or reach out to us in [Odigos Slack](https://join.slack.com/t/odigos/shared_invite/zt-24u91yknm-0fLXu6qnqYfNHS_GSUgTJw)