> ## Documentation Index
> Fetch the complete documentation index at: https://docs.odigos.io/llms.txt
> Use this file to discover all available pages before exploring further.
# odictl
> Launching and navigating the terminal user interface (TUI); `odictl`
## Introduction
The Odigos VM Agent is installed with a terminal user interface (TUI) called `odictl`. `odictl` is one method you can use
to instrument processes and services, set up destinations, and add actions to Odigos.
Want centralized visibility and management? See [Connecting VM Agent](/central/adding-connections/vmagent) to connect this host to Odigos Central.
To launch `odictl`, run the following command from the command-line:
```shell theme={null}
odictl
```
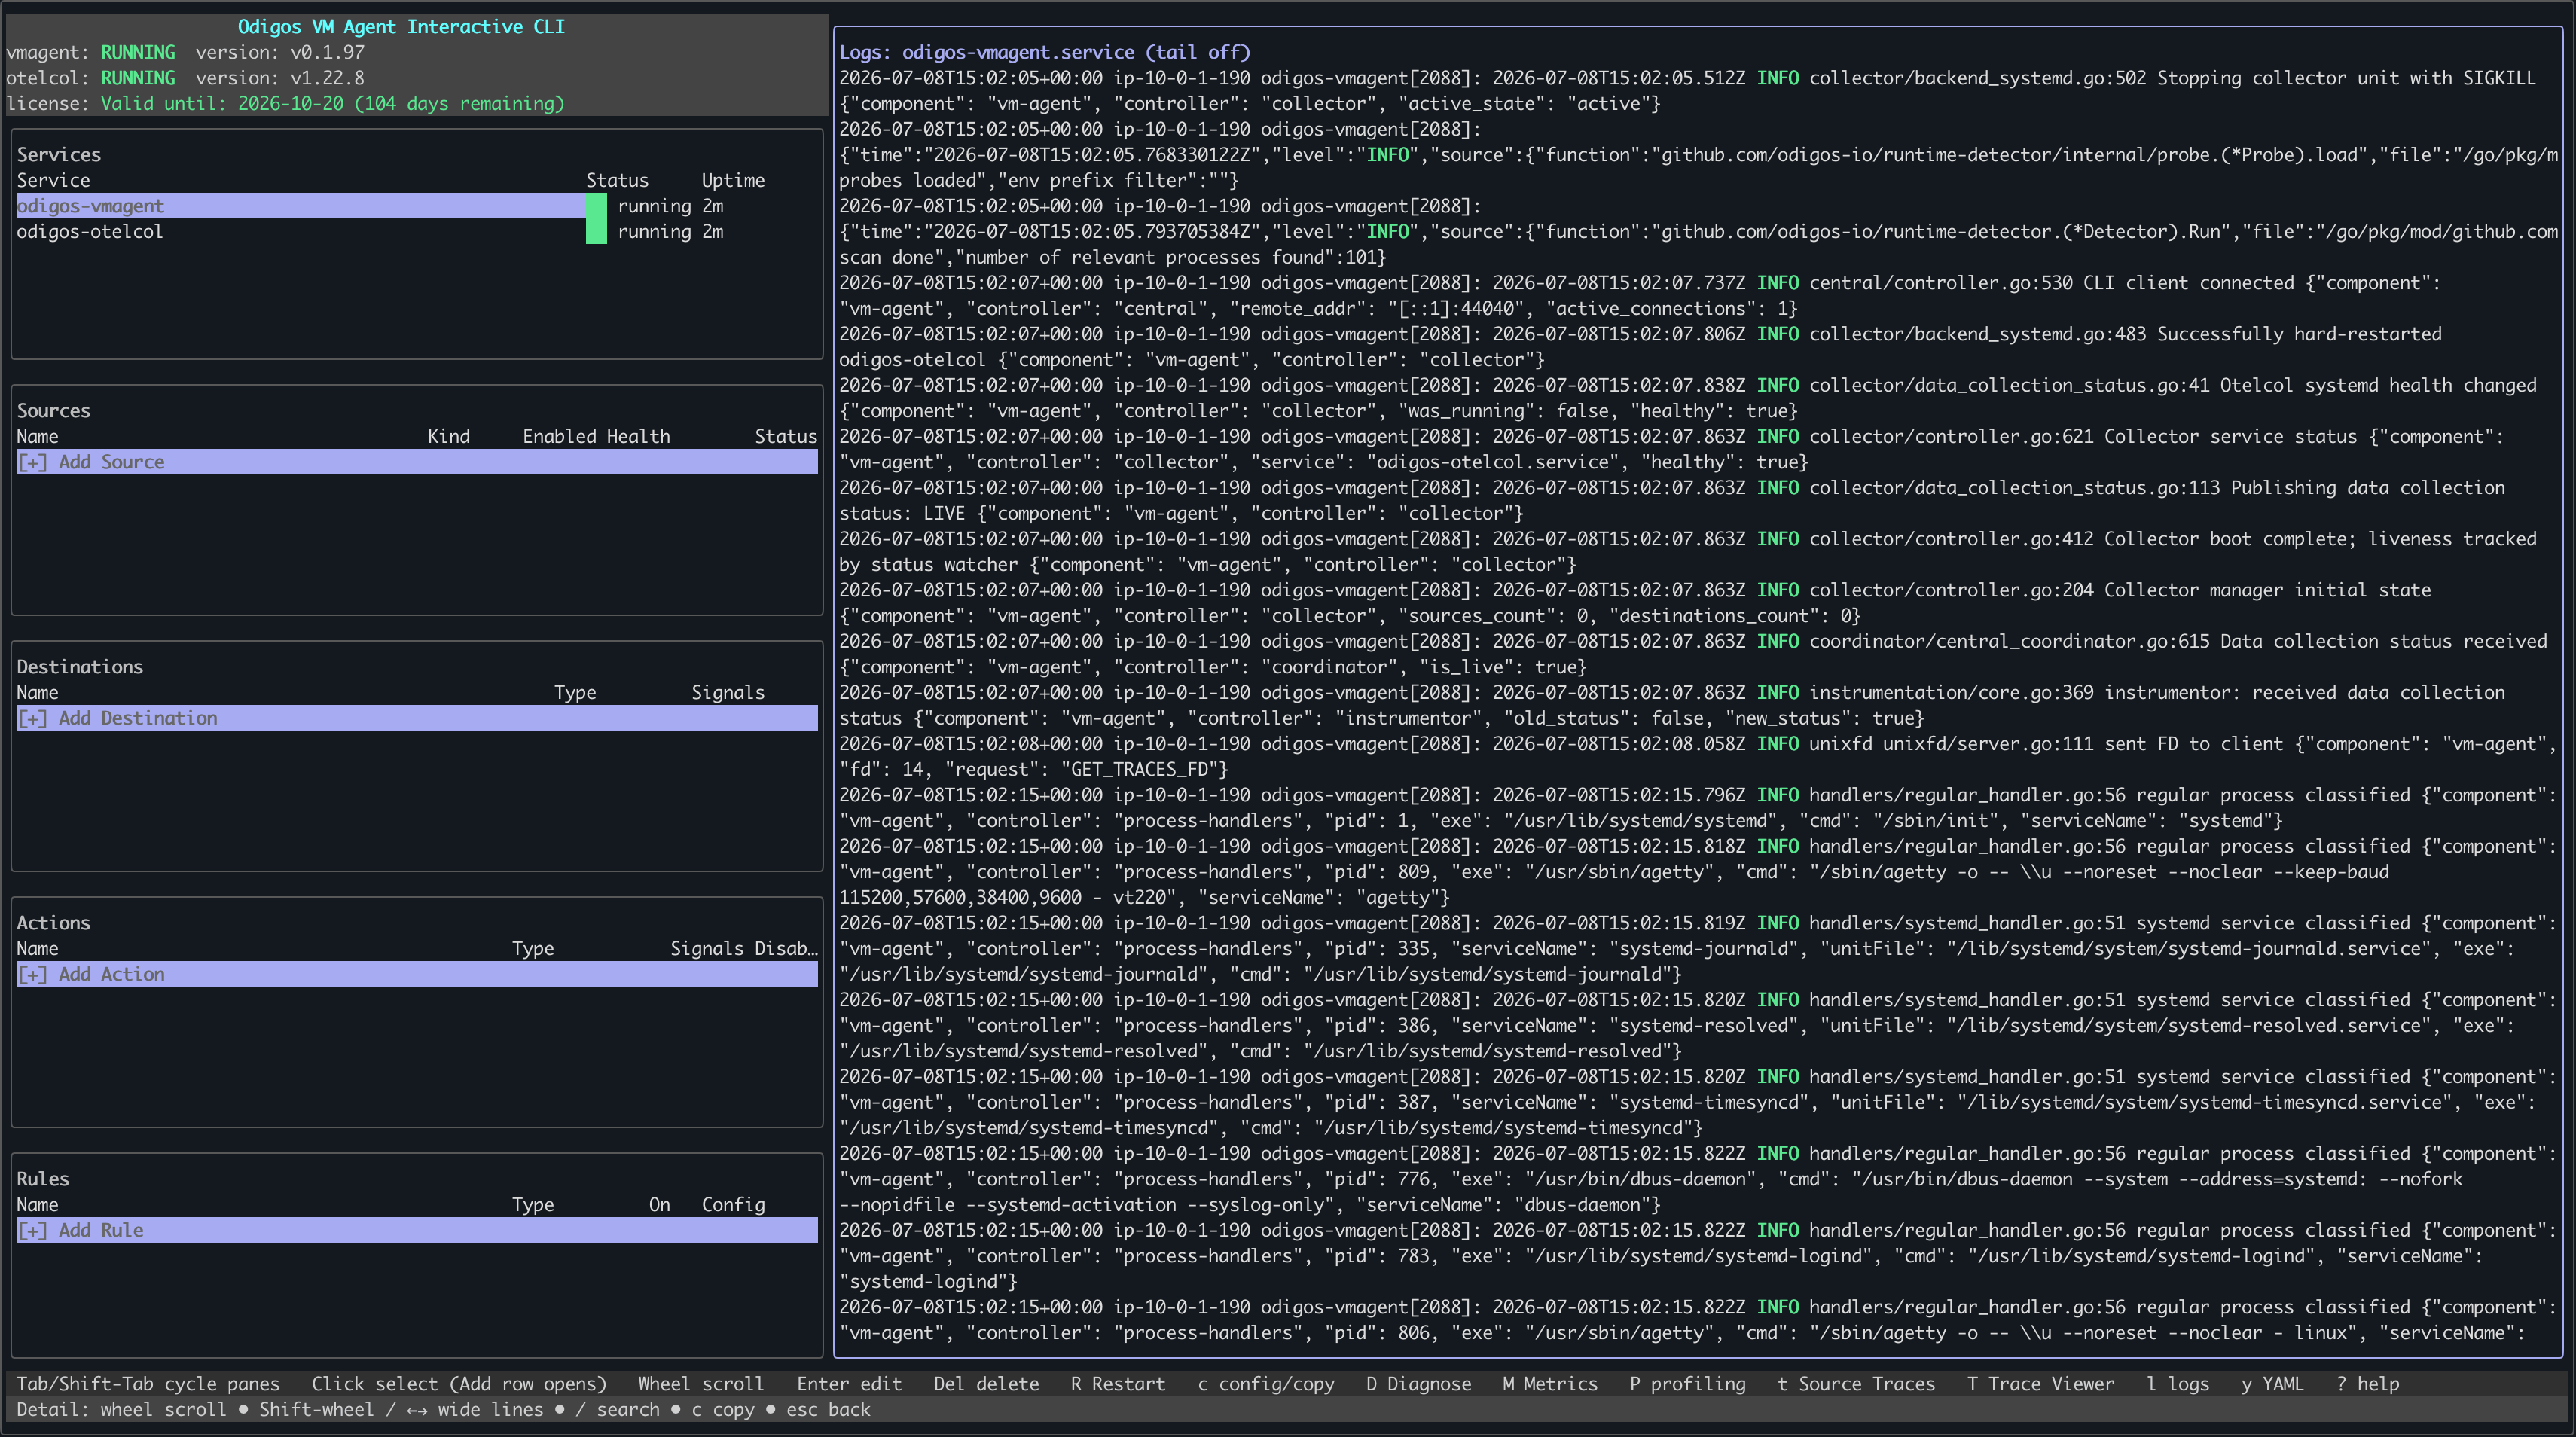
You will then see a screen similar to the one below:
 ## Navigation
The odictl interface has five main sections: Services, Logs,
Sources, Destinations, and Actions.
Use the keyboard to move between them; if you are connected through an `ssh` session from a terminal that supports
mouse input, you can navigate the interface with your mouse.
## Navigating the Interface
The following describes how to navigate using the keyboard:
| Key | Action |
| ------------------- | ----------------------------------------- |
| `Tab` / `Shift+Tab` | Cycle panes |
| `↑` / `↓` | Move between items in the current section |
| `Enter` | Select the highlighted item |
| `q` / `Esc` | Quit |
| `s` | Focus Services |
| `o` | Focus Sources |
| `d` | Focus Destinations |
| `a` | Focus Actions |
| `c` | Open Configuration Editor |
| `r` | Reload status + config |
| `e` | Edit selected |
| `Del` / `Backspace` | Delete selected |
| `l` | Show service logs |
| `y` | Show YAML config |
| `?` / `h` | Display full keymap |
The currently selected item has a secondary border around it. Press `Enter` to select it.
#### Requirements
Mouse support requires:
* A terminal emulator that supports mouse input
* An SSH session that forwards mouse events
Most modern terminal emulators support mouse interaction automatically.
To navigate:
* Click a **section** to switch sections
* Click an **item** to select it
## Services Panel
The Services section shows the status of the two services that run the Odigos VM Agent:
odigos-vmagent and odigos-otelcol. When you highlight a service,
the log window shows that service's logs.
## Navigation
The odictl interface has five main sections: Services, Logs,
Sources, Destinations, and Actions.
Use the keyboard to move between them; if you are connected through an `ssh` session from a terminal that supports
mouse input, you can navigate the interface with your mouse.
## Navigating the Interface
The following describes how to navigate using the keyboard:
| Key | Action |
| ------------------- | ----------------------------------------- |
| `Tab` / `Shift+Tab` | Cycle panes |
| `↑` / `↓` | Move between items in the current section |
| `Enter` | Select the highlighted item |
| `q` / `Esc` | Quit |
| `s` | Focus Services |
| `o` | Focus Sources |
| `d` | Focus Destinations |
| `a` | Focus Actions |
| `c` | Open Configuration Editor |
| `r` | Reload status + config |
| `e` | Edit selected |
| `Del` / `Backspace` | Delete selected |
| `l` | Show service logs |
| `y` | Show YAML config |
| `?` / `h` | Display full keymap |
The currently selected item has a secondary border around it. Press `Enter` to select it.
#### Requirements
Mouse support requires:
* A terminal emulator that supports mouse input
* An SSH session that forwards mouse events
Most modern terminal emulators support mouse interaction automatically.
To navigate:
* Click a **section** to switch sections
* Click an **item** to select it
## Services Panel
The Services section shows the status of the two services that run the Odigos VM Agent:
odigos-vmagent and odigos-otelcol. When you highlight a service,
the log window shows that service's logs.
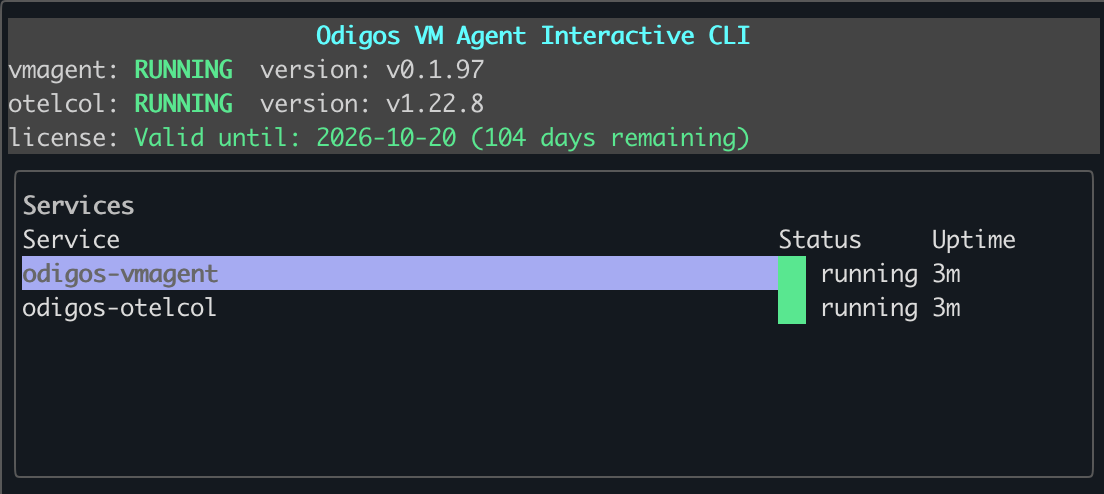 The following animation shows switching between viewing logs for odigos-vmagent
and odigos-otelcol in the Logs section.
## Logs Panel
The Logs section shows a live stream of logs for the odigos-vmagent and
odigos-otelcol Odigos services. When the section is focused, use the ↑ / ↓ keys
or the mouse wheel to scroll through the logs.
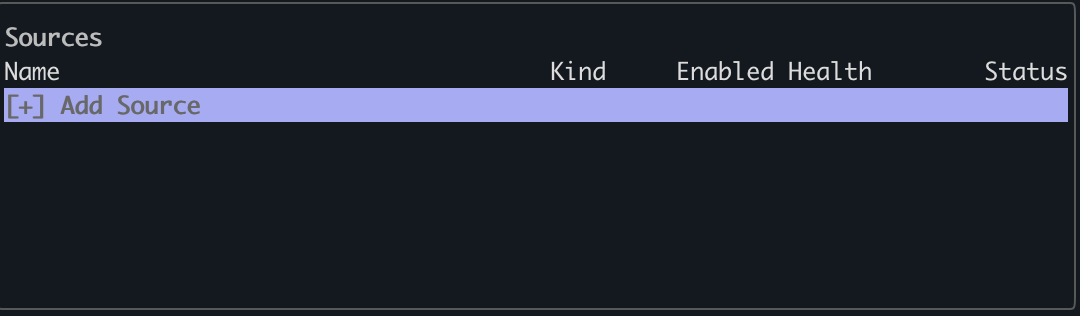
## Sources Panel
Sources is where you define the systemd services or Linux processes on the host system that you want to instrument with
the Odigos VM Agent. See [Add Sources](/vmagent/setup/configuration/add-sources) to learn how.
The following animation shows switching between viewing logs for odigos-vmagent
and odigos-otelcol in the Logs section.
## Logs Panel
The Logs section shows a live stream of logs for the odigos-vmagent and
odigos-otelcol Odigos services. When the section is focused, use the ↑ / ↓ keys
or the mouse wheel to scroll through the logs.
## Sources Panel
Sources is where you define the systemd services or Linux processes on the host system that you want to instrument with
the Odigos VM Agent. See [Add Sources](/vmagent/setup/configuration/add-sources) to learn how.
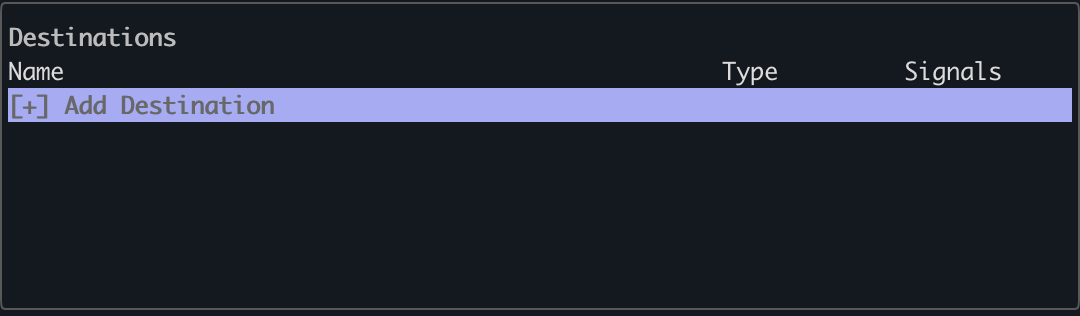
 ## Destinations Panel
[Destinations](/enterprise/backends-overview) are backends that accept data from the Odigos VM Agent.
Odigos lets you [add as many destinations](/vmagent/setup/configuration/add-destinations) as you like, enabling you to
execute different use cases such as:
* Using different backends for different types of OpenTelemetry signals
* Migrating from one backend to another
* Testing different backends for different OpenTelemetry use cases
## Destinations Panel
[Destinations](/enterprise/backends-overview) are backends that accept data from the Odigos VM Agent.
Odigos lets you [add as many destinations](/vmagent/setup/configuration/add-destinations) as you like, enabling you to
execute different use cases such as:
* Using different backends for different types of OpenTelemetry signals
* Migrating from one backend to another
* Testing different backends for different OpenTelemetry use cases
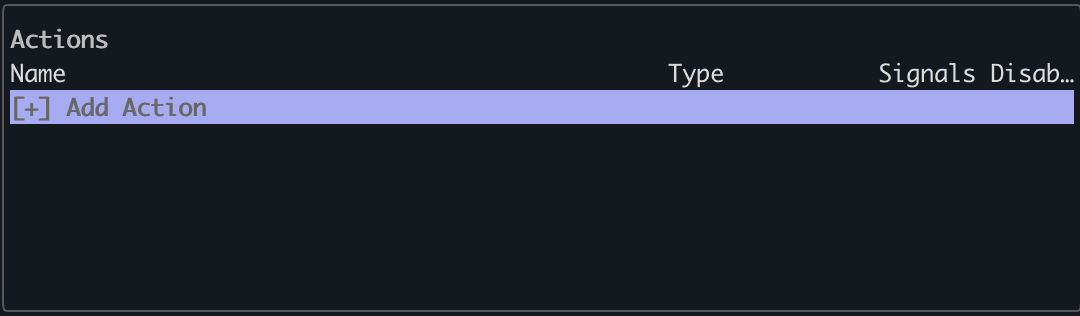
 ## Actions Panel
Actions let you modify OpenTelemetry data from Odigos Sources before it is exported to your destinations. Odigos
implements actions using OpenTelemetry Collector processors—components that transform, filter, or enrich telemetry
before it is sent to your destinations.
See [Actions overview](/vmagent/setup/configuration/actions/overview) to add or edit actions. For action types and processor options, see
[Odigos Actions](/enterprise/pipeline/actions/introduction).
## Actions Panel
Actions let you modify OpenTelemetry data from Odigos Sources before it is exported to your destinations. Odigos
implements actions using OpenTelemetry Collector processors—components that transform, filter, or enrich telemetry
before it is sent to your destinations.
See [Actions overview](/vmagent/setup/configuration/actions/overview) to add or edit actions. For action types and processor options, see
[Odigos Actions](/enterprise/pipeline/actions/introduction).
 ## Configuration Editor
The Configuration Editor lets you view and modify the VM Agent's configuration directly from the TUI
without manually editing YAML files.
### Opening the Configuration Editor
Press c from any panel to open the Configuration Editor. The editor replaces
the main dashboard with a three-column layout:
| Column | Purpose |
| -------------- | -------------------------------------------------------------------------------------------------------------------------------------------------------------------------------------------- |
| **Section** | Top-level configuration categories such as Logging, Network, Central, Process controller, Data collection, Instrumentation controller, and Profiling. |
| **Subsection** | Groups within a section. For example, Instrumentation controller contains subsections for Java instrumentation and its top-level fields. Sections with a single group show the section name. |
| **Values** | The editable fields for the selected subsection. Each field shows its label, an optional description, and an input widget (text input, dropdown, or multi-line editor). |
### Navigating the Editor
| Key | Action |
| ------------------- | ----------------------------------------------------------- |
| `Tab` / `Shift+Tab` | Move focus between the three columns |
| `↑` / `↓` | Move between items in the focused column |
| `Ctrl+←` | Jump back from the Values column to Subsection |
| `Enter` | Open a dropdown or confirm a selection |
| `Ctrl+S` | Save all changes to disk and reload the agent configuration |
| `Esc` | Discard changes and return to the main dashboard |
Mouse navigation is also supported: click a section, subsection, or field to focus it, and use the
scroll wheel to browse long lists of fields.
### Editing Fields
* **Text fields**: Type directly into the input to change the value.
* **Boolean / enum fields**: A dropdown appears with the available options. Use `↑` / `↓` to pick a
value, then press `Enter` to confirm.
* **Read-only fields**: Displayed with a *(read-only)* label and cannot be modified.
### Saving Changes
Press Ctrl+S to validate and save. If validation fails (for example, a
value is out of range), an error message appears at the top of the Values column. Fix the indicated
field and save again. Saving writes the updated configuration to the YAML file on disk and triggers
an automatic reload of the affected agent components.
### Configuration Sections
Controls how the VM Agent writes logs to stdout and to a rotated log file on disk.
| Field | Description |
| -------------- | ---------------------------------------------------------------------- |
| **Log level** | Minimum severity written to stdout (`debug`, `info`, `warn`, `error`). |
| **Log format** | Output format: `console` (human-readable) or `json` (structured). |
**Log rotation** subsection — settings for the on-disk rotated log file:
| Field | Description |
| ---------------- | ----------------------------------------------------------------------------- |
| **Filename** | Path to the rotated log file. |
| **File level** | Minimum severity written to the file. Captures levels that stdout suppresses. |
| **Max size mb** | Maximum file size in MB before rotation. |
| **Max backups** | Number of old rotated files to retain. |
| **Max age days** | Days to keep old log files before deletion. |
| **Compress** | Whether rotated files are gzip-compressed. |
Port assignments for the VM Agent process and the OpenTelemetry Collector. Changing collector receiver
ports restarts the collector and re-instruments affected workloads.
**Vmagent** subsection:
| Field | Description |
| -------------- | --------------------------------------------------- |
| **Cli port** | Port for the CLI WebSocket server used by `odictl`. |
| **Pprof port** | Port for the VM Agent pprof profiling server. |
**Collector** subsection:
| Field | Description |
| --------------------- | ------------------------------------------- |
| **Health check port** | OTel Collector health-check endpoint. |
| **Pprof port** | OTel Collector pprof profiling endpoint. |
| **Zpages port** | OTel Collector zpages debugging endpoint. |
| **Prometheus port** | OTel Collector Prometheus metrics endpoint. |
**Collector receivers** subsection:
| Field | Description |
| ------------------ | ----------------------------------------------------------------------------- |
| **OTLP gRPC port** | Port for the OTLP gRPC receiver. Changing this restarts instrumented sources. |
| **OTLP HTTP port** | Port for the OTLP HTTP receiver. Changing this restarts instrumented sources. |
Settings for connecting this VM Agent to an Odigos Central management plane. When **Enabled** is
`false`, the remaining fields are ignored and the agent runs standalone.
| Field | Description |
| ------------------------------ | -------------------------------------------------------------- |
| **Enabled** | Enable or disable the Central controller. |
| **Endpoint** | WebSocket endpoint of the Central server (`host:port` or URL). |
| **Agent name** | Identifier for this VM Agent instance. |
| **Platform type** | Platform identifier (e.g. `vm-agent`). |
| **Version** | Reported agent version. |
| **Deployment id** | Unique deployment identifier *(read-only)*. |
| **Connection timeout** | Timeout in seconds for the initial connection. |
| **Reconnection delay** | Delay in seconds between reconnection attempts. |
| **Max reconnection attempts** | Maximum number of reconnection retries. |
| **Verbose logging** | Enable detailed logging for Central communication. |
| **Exit on connection failure** | Force the agent to exit if the Central connection fails. |
Controls how the agent discovers and monitors processes on the host.
| Field | Description |
| ----------------------- | ------------------------------------------------------------------------------------------ |
| **Ignored exe paths** | List of executable paths excluded from process monitoring. |
| **Enabled classifiers** | Toggle individual process classifiers (`docker`, `systemd`, `containerd`, `process`). |
| **Service name rules** | Rules for extracting service names from process arguments using pattern/template matching. |
Configuration passed to the OpenTelemetry Collector instance managed by the VM Agent.
**Otel collector** subsection:
| Field | Description |
| ---------- | ------------------------------------------------------------------------------------------------------------ |
| **Config** | Key-value pairs written as environment variables to the `odigos-otelcol.conf` file (e.g. `OTELCOL_OPTIONS`). |
Controls how the agent instruments discovered processes. Top-level fields apply globally; the
Java instrumentation subsection targets Java-specific behavior.
| Field | Description |
| ------------------------------------------ | ------------------------------------------------------------------------------------------------------------------------------------------------------------------------ |
| **Dynamic loader match threshold percent** | Match threshold (0–100) for partial command-line matching when the dynamic loader attaches to a process. `0` = any match if the executable matches; `100` = exact match. |
**Java instrumentation** subsection:
| Field | Description |
| ----------------------------- | --------------------------------------------------------------------------- |
| **Sdk type** | Java agent variant: `java-enterprise` or `java-ebpf-instrumentations`. |
| **Use dynamic attach** | Whether to attach the Java agent at runtime without restarting the process. |
| **Disabled instrumentations** | List of Java instrumentation names to turn off. |
Enables **continuous CPU profiling** (eBPF, OTLP Profiles) on **odigos-otelcol**. This is separate from Go **pprof** (see **Pprof** below). See [Continuous Profiling](/vmagent/instrumentations/profiling/overview) for the full setup.
| Field | Description |
| --------------------- | ----------------------------------------------------------------------------------------------------------------------------------------------- |
| **profiling.enabled** | Turns on the `profiling` receiver and the `profiles` pipeline whenever a destination is configured with the `PROFILES` signal. Default `false`. |
```yaml theme={null}
profiling:
enabled: true
```
Toggling this field reloads the collector and the PID → `service.name` registry within seconds — no vm-agent restart is required.
Controls the **Go `net/http/pprof`** debug endpoint for the **vm-agent process only**. This is for debugging the agent itself and has nothing to do with application continuous CPU profiling (see **Profiling** above for that).
| Field | Description |
| ----------- | ---------------------------------------------------------------------------------- |
| **Enabled** | Expose pprof on `network.vmagent.pprof_port` (default `7771`). Enabled by default. |
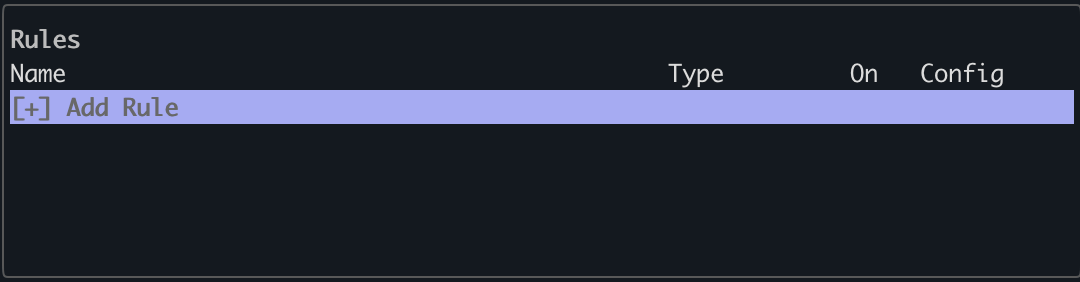
## Instrumentation Rules Panel
Instrumentation Rules control how telemetry is recorded from your instrumented sources. A rule can be applied to
specific sources and instrumentation libraries, letting you control what attributes, headers, or payloads are collected
and how custom instrumentations behave.
For rule types and configuration options, see [Instrumentation rules overview](/vmagent/setup/configuration/instrumentation-rules/overview).
## Configuration Editor
The Configuration Editor lets you view and modify the VM Agent's configuration directly from the TUI
without manually editing YAML files.
### Opening the Configuration Editor
Press c from any panel to open the Configuration Editor. The editor replaces
the main dashboard with a three-column layout:
| Column | Purpose |
| -------------- | -------------------------------------------------------------------------------------------------------------------------------------------------------------------------------------------- |
| **Section** | Top-level configuration categories such as Logging, Network, Central, Process controller, Data collection, Instrumentation controller, and Profiling. |
| **Subsection** | Groups within a section. For example, Instrumentation controller contains subsections for Java instrumentation and its top-level fields. Sections with a single group show the section name. |
| **Values** | The editable fields for the selected subsection. Each field shows its label, an optional description, and an input widget (text input, dropdown, or multi-line editor). |
### Navigating the Editor
| Key | Action |
| ------------------- | ----------------------------------------------------------- |
| `Tab` / `Shift+Tab` | Move focus between the three columns |
| `↑` / `↓` | Move between items in the focused column |
| `Ctrl+←` | Jump back from the Values column to Subsection |
| `Enter` | Open a dropdown or confirm a selection |
| `Ctrl+S` | Save all changes to disk and reload the agent configuration |
| `Esc` | Discard changes and return to the main dashboard |
Mouse navigation is also supported: click a section, subsection, or field to focus it, and use the
scroll wheel to browse long lists of fields.
### Editing Fields
* **Text fields**: Type directly into the input to change the value.
* **Boolean / enum fields**: A dropdown appears with the available options. Use `↑` / `↓` to pick a
value, then press `Enter` to confirm.
* **Read-only fields**: Displayed with a *(read-only)* label and cannot be modified.
### Saving Changes
Press Ctrl+S to validate and save. If validation fails (for example, a
value is out of range), an error message appears at the top of the Values column. Fix the indicated
field and save again. Saving writes the updated configuration to the YAML file on disk and triggers
an automatic reload of the affected agent components.
### Configuration Sections
Controls how the VM Agent writes logs to stdout and to a rotated log file on disk.
| Field | Description |
| -------------- | ---------------------------------------------------------------------- |
| **Log level** | Minimum severity written to stdout (`debug`, `info`, `warn`, `error`). |
| **Log format** | Output format: `console` (human-readable) or `json` (structured). |
**Log rotation** subsection — settings for the on-disk rotated log file:
| Field | Description |
| ---------------- | ----------------------------------------------------------------------------- |
| **Filename** | Path to the rotated log file. |
| **File level** | Minimum severity written to the file. Captures levels that stdout suppresses. |
| **Max size mb** | Maximum file size in MB before rotation. |
| **Max backups** | Number of old rotated files to retain. |
| **Max age days** | Days to keep old log files before deletion. |
| **Compress** | Whether rotated files are gzip-compressed. |
Port assignments for the VM Agent process and the OpenTelemetry Collector. Changing collector receiver
ports restarts the collector and re-instruments affected workloads.
**Vmagent** subsection:
| Field | Description |
| -------------- | --------------------------------------------------- |
| **Cli port** | Port for the CLI WebSocket server used by `odictl`. |
| **Pprof port** | Port for the VM Agent pprof profiling server. |
**Collector** subsection:
| Field | Description |
| --------------------- | ------------------------------------------- |
| **Health check port** | OTel Collector health-check endpoint. |
| **Pprof port** | OTel Collector pprof profiling endpoint. |
| **Zpages port** | OTel Collector zpages debugging endpoint. |
| **Prometheus port** | OTel Collector Prometheus metrics endpoint. |
**Collector receivers** subsection:
| Field | Description |
| ------------------ | ----------------------------------------------------------------------------- |
| **OTLP gRPC port** | Port for the OTLP gRPC receiver. Changing this restarts instrumented sources. |
| **OTLP HTTP port** | Port for the OTLP HTTP receiver. Changing this restarts instrumented sources. |
Settings for connecting this VM Agent to an Odigos Central management plane. When **Enabled** is
`false`, the remaining fields are ignored and the agent runs standalone.
| Field | Description |
| ------------------------------ | -------------------------------------------------------------- |
| **Enabled** | Enable or disable the Central controller. |
| **Endpoint** | WebSocket endpoint of the Central server (`host:port` or URL). |
| **Agent name** | Identifier for this VM Agent instance. |
| **Platform type** | Platform identifier (e.g. `vm-agent`). |
| **Version** | Reported agent version. |
| **Deployment id** | Unique deployment identifier *(read-only)*. |
| **Connection timeout** | Timeout in seconds for the initial connection. |
| **Reconnection delay** | Delay in seconds between reconnection attempts. |
| **Max reconnection attempts** | Maximum number of reconnection retries. |
| **Verbose logging** | Enable detailed logging for Central communication. |
| **Exit on connection failure** | Force the agent to exit if the Central connection fails. |
Controls how the agent discovers and monitors processes on the host.
| Field | Description |
| ----------------------- | ------------------------------------------------------------------------------------------ |
| **Ignored exe paths** | List of executable paths excluded from process monitoring. |
| **Enabled classifiers** | Toggle individual process classifiers (`docker`, `systemd`, `containerd`, `process`). |
| **Service name rules** | Rules for extracting service names from process arguments using pattern/template matching. |
Configuration passed to the OpenTelemetry Collector instance managed by the VM Agent.
**Otel collector** subsection:
| Field | Description |
| ---------- | ------------------------------------------------------------------------------------------------------------ |
| **Config** | Key-value pairs written as environment variables to the `odigos-otelcol.conf` file (e.g. `OTELCOL_OPTIONS`). |
Controls how the agent instruments discovered processes. Top-level fields apply globally; the
Java instrumentation subsection targets Java-specific behavior.
| Field | Description |
| ------------------------------------------ | ------------------------------------------------------------------------------------------------------------------------------------------------------------------------ |
| **Dynamic loader match threshold percent** | Match threshold (0–100) for partial command-line matching when the dynamic loader attaches to a process. `0` = any match if the executable matches; `100` = exact match. |
**Java instrumentation** subsection:
| Field | Description |
| ----------------------------- | --------------------------------------------------------------------------- |
| **Sdk type** | Java agent variant: `java-enterprise` or `java-ebpf-instrumentations`. |
| **Use dynamic attach** | Whether to attach the Java agent at runtime without restarting the process. |
| **Disabled instrumentations** | List of Java instrumentation names to turn off. |
Enables **continuous CPU profiling** (eBPF, OTLP Profiles) on **odigos-otelcol**. This is separate from Go **pprof** (see **Pprof** below). See [Continuous Profiling](/vmagent/instrumentations/profiling/overview) for the full setup.
| Field | Description |
| --------------------- | ----------------------------------------------------------------------------------------------------------------------------------------------- |
| **profiling.enabled** | Turns on the `profiling` receiver and the `profiles` pipeline whenever a destination is configured with the `PROFILES` signal. Default `false`. |
```yaml theme={null}
profiling:
enabled: true
```
Toggling this field reloads the collector and the PID → `service.name` registry within seconds — no vm-agent restart is required.
Controls the **Go `net/http/pprof`** debug endpoint for the **vm-agent process only**. This is for debugging the agent itself and has nothing to do with application continuous CPU profiling (see **Profiling** above for that).
| Field | Description |
| ----------- | ---------------------------------------------------------------------------------- |
| **Enabled** | Expose pprof on `network.vmagent.pprof_port` (default `7771`). Enabled by default. |
## Instrumentation Rules Panel
Instrumentation Rules control how telemetry is recorded from your instrumented sources. A rule can be applied to
specific sources and instrumentation libraries, letting you control what attributes, headers, or payloads are collected
and how custom instrumentations behave.
For rule types and configuration options, see [Instrumentation rules overview](/vmagent/setup/configuration/instrumentation-rules/overview).