Deploying the target application
We are going to install Odigos demo application that consists of 6 microservices written in Java, Go, Python, Node.js, .NET and PHP.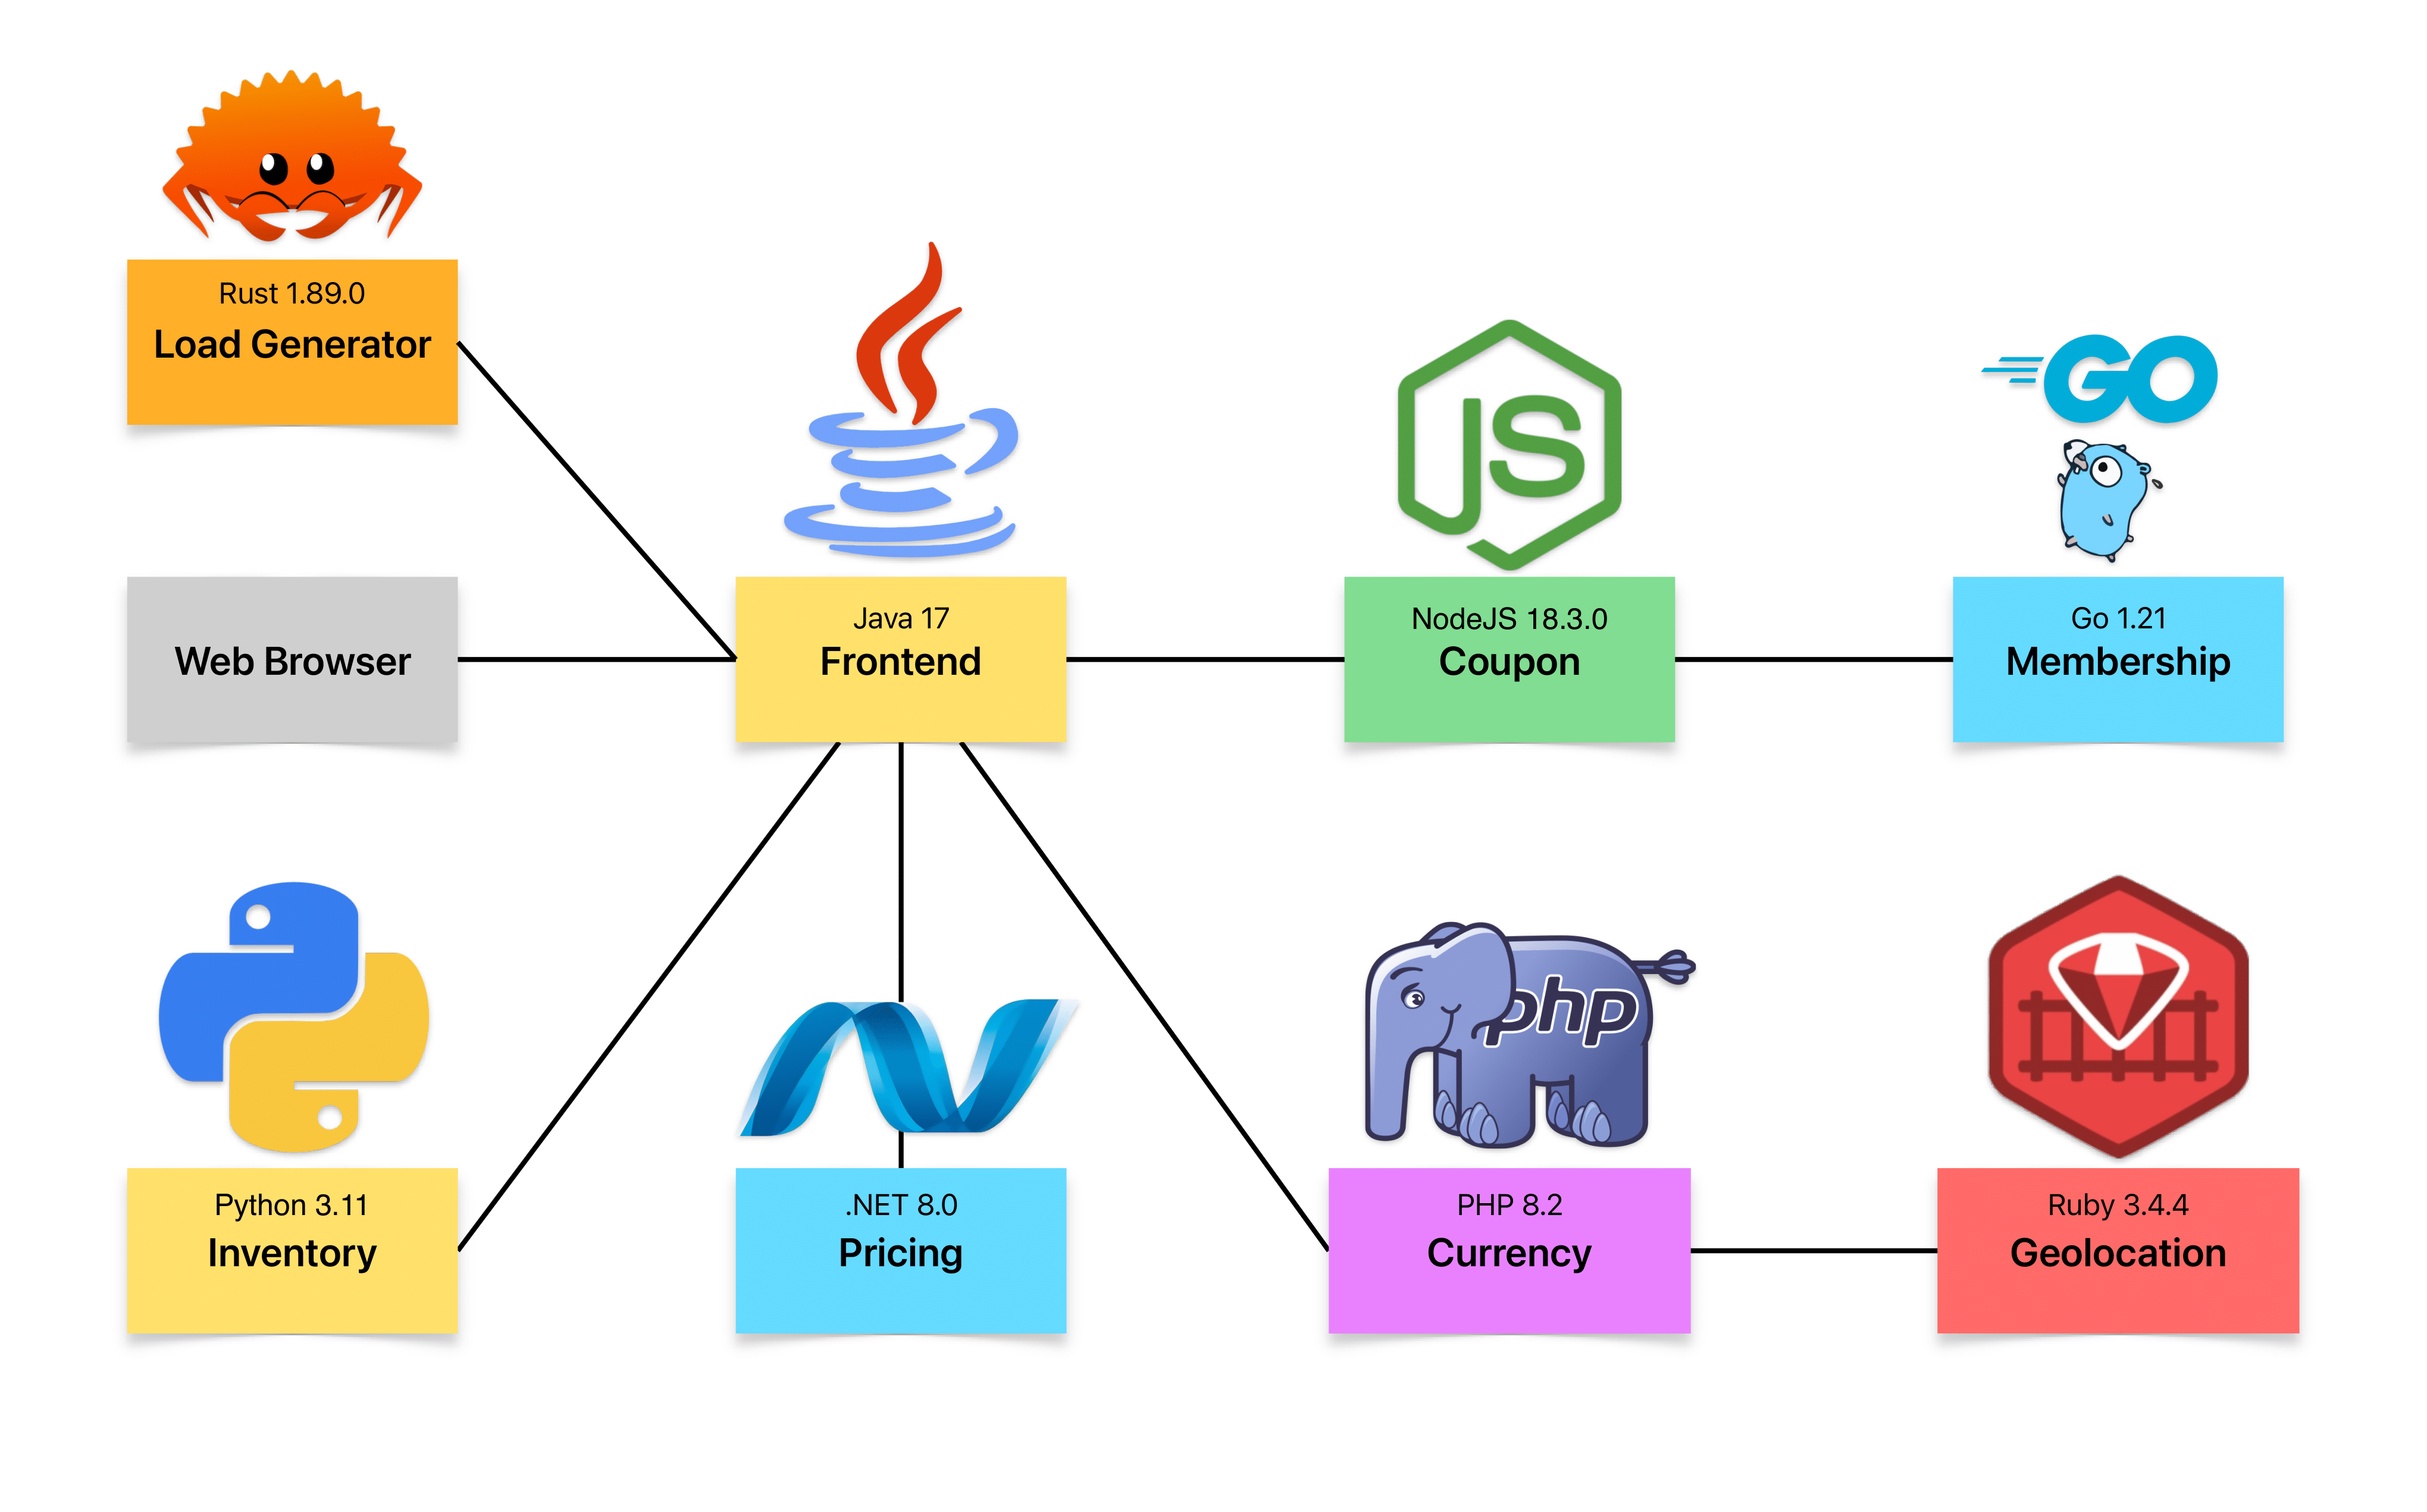
- Install the application using the following commands:
- APT
- DNF
- Check that the application is running:
active (running) state.
Deploying Jaeger
This Jaeger setup is intended for demonstration purposes only. In a production environment, you should deploy Jaeger or any other backend solution in a more reliable and scalable manner. Install Jaeger using the following commands:- Download a version of Jaeger which is compatible to your OS and arch from GitHub releases page and extract the archive.
v1.0.57:
- amd64
- arm64
- Run the Jaeger All-in-One binary:
- Browse to Jaeger UI at
http://localhost:16686. Replacelocalhostwith the IP address of the machine where Jaeger is running if you are accessing it from a different machine.