Exporting Profiles to a Destination
The Odigos UI gives you fast, in-memory access to profiles for enabled Sources — ideal for live investigation when you don’t need historical data but just want to inspect certain workloads on demand. For long-term retention, time-range analysis, and cross-service comparison, you can route profile data to an external backend the same way you route traces, metrics or logs, by configuring a Destination in Odigos. When a profile-capable Destination is configured, the gateway starts exporting OTLP Profiles to that backend alongside the Odigos UI.Supported Format
Profile data is emitted as OTLP Profiles — the OpenTelemetry profiles signal. Any backend that can ingest OTLP Profiles over HTTP can, in principle, receive data from Odigos.OTLP Profiles is still experimental — the wire format and ingestion path (
/v1development/profiles) may change. Keep your backend on a recent version that speaks a compatible protocol revision.Prerequisites
Before exporting profiles to a Destination:- Profiling is enabled cluster-wide (
profiling.enabled=trueHelm value). See Getting Started. - The workload you want to profile is registered as a Source.
- The Destination CRD is configured with the
PROFILESsignal. - Your chosen backend is reachable from the Odigos gateway and accepts OTLP Profiles.
PROFILES signal.
Try out configuring a profiling Destinations

Pyroscope
Self-hosted Grafana Pyroscope. Receives OTLP profiles over HTTP at
/v1development/profiles.Example: Pyroscope
1
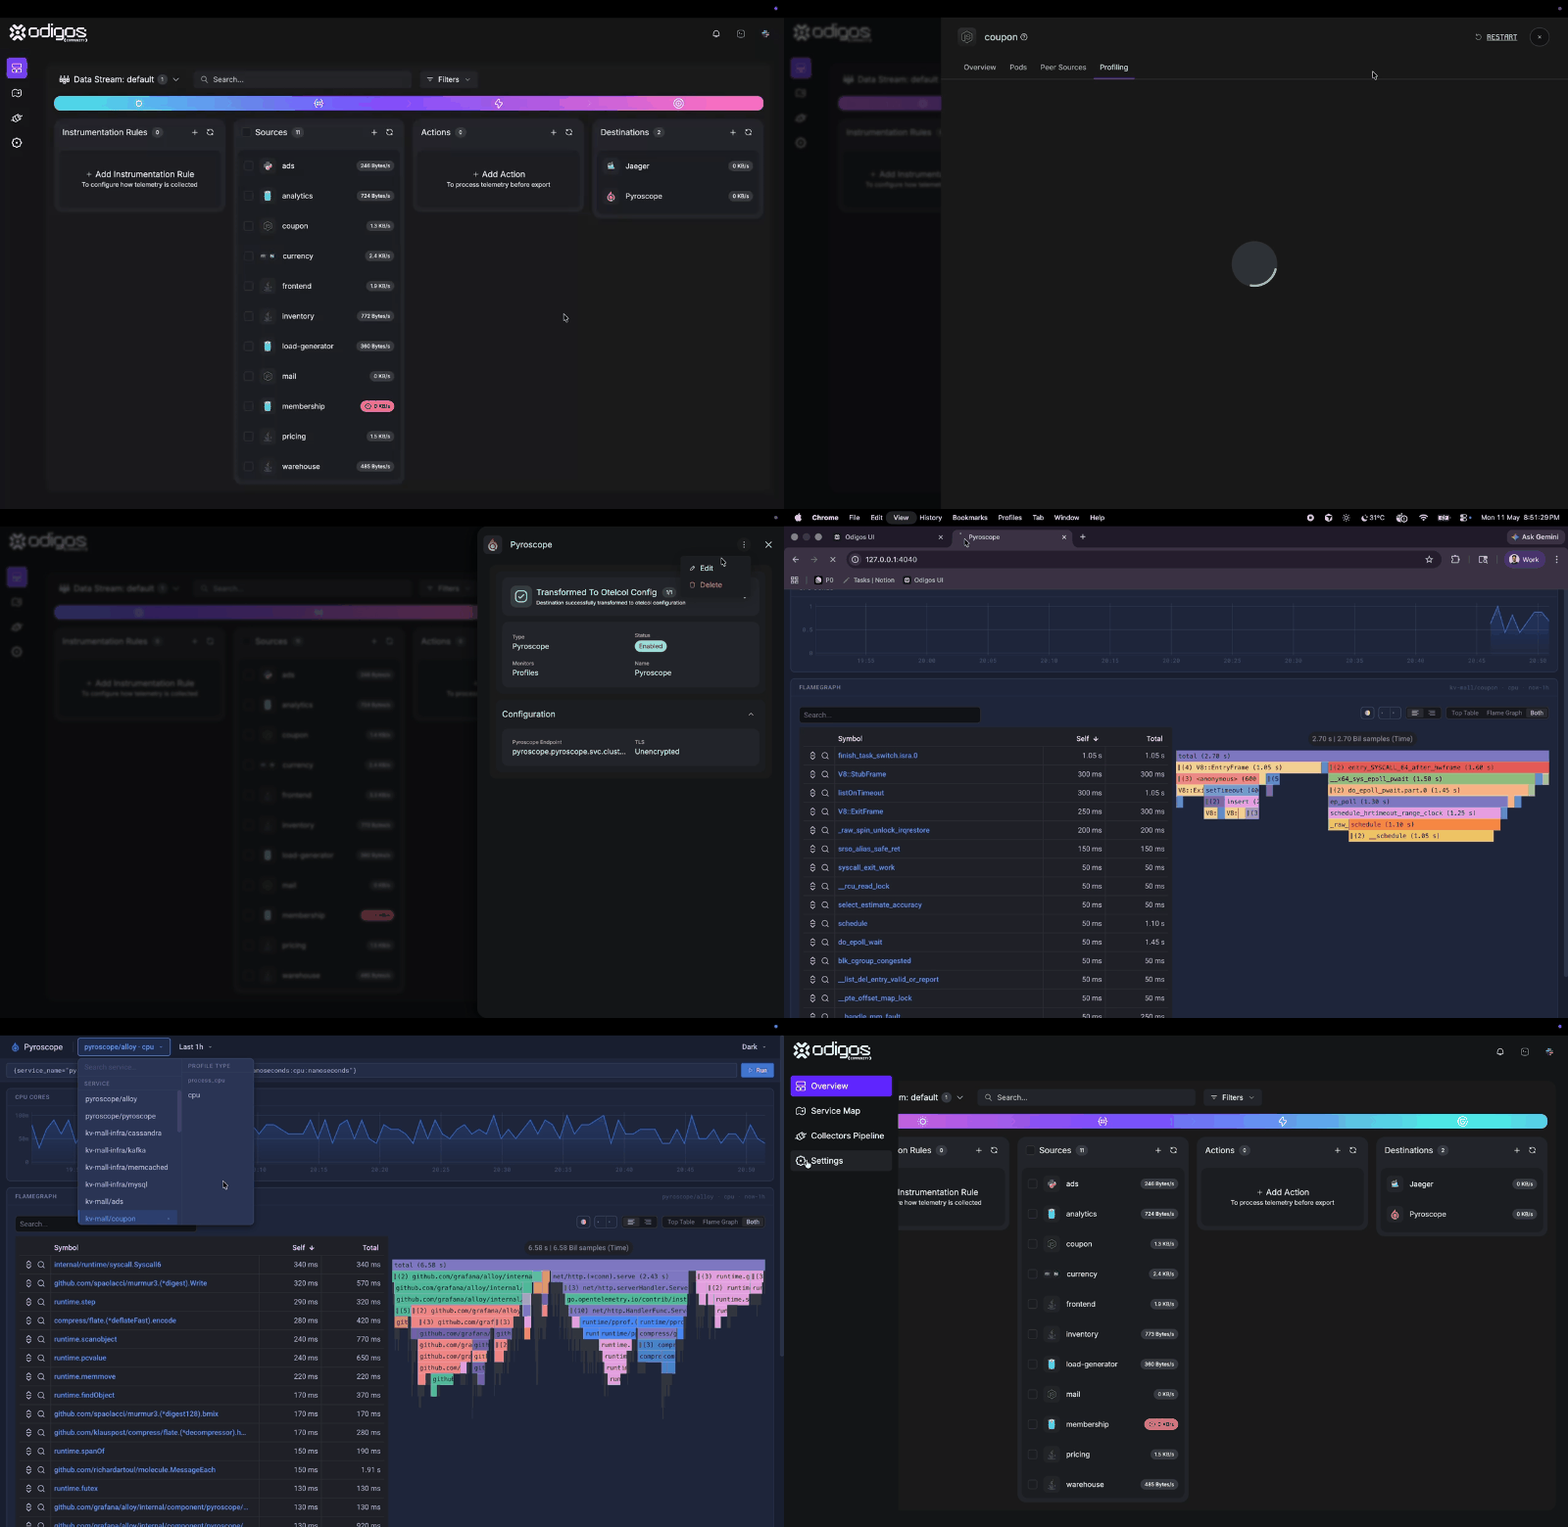
Enable profiling on the cluster
Follow Getting started and set
profiling.enabled=true so profiling is active on the cluster.2
Add a Pyroscope destination with Profiles
In Destinations, add Pyroscope and enable the Profiles signal so the gateway forwards OTLP Profiles to Pyroscope as well as to the UI.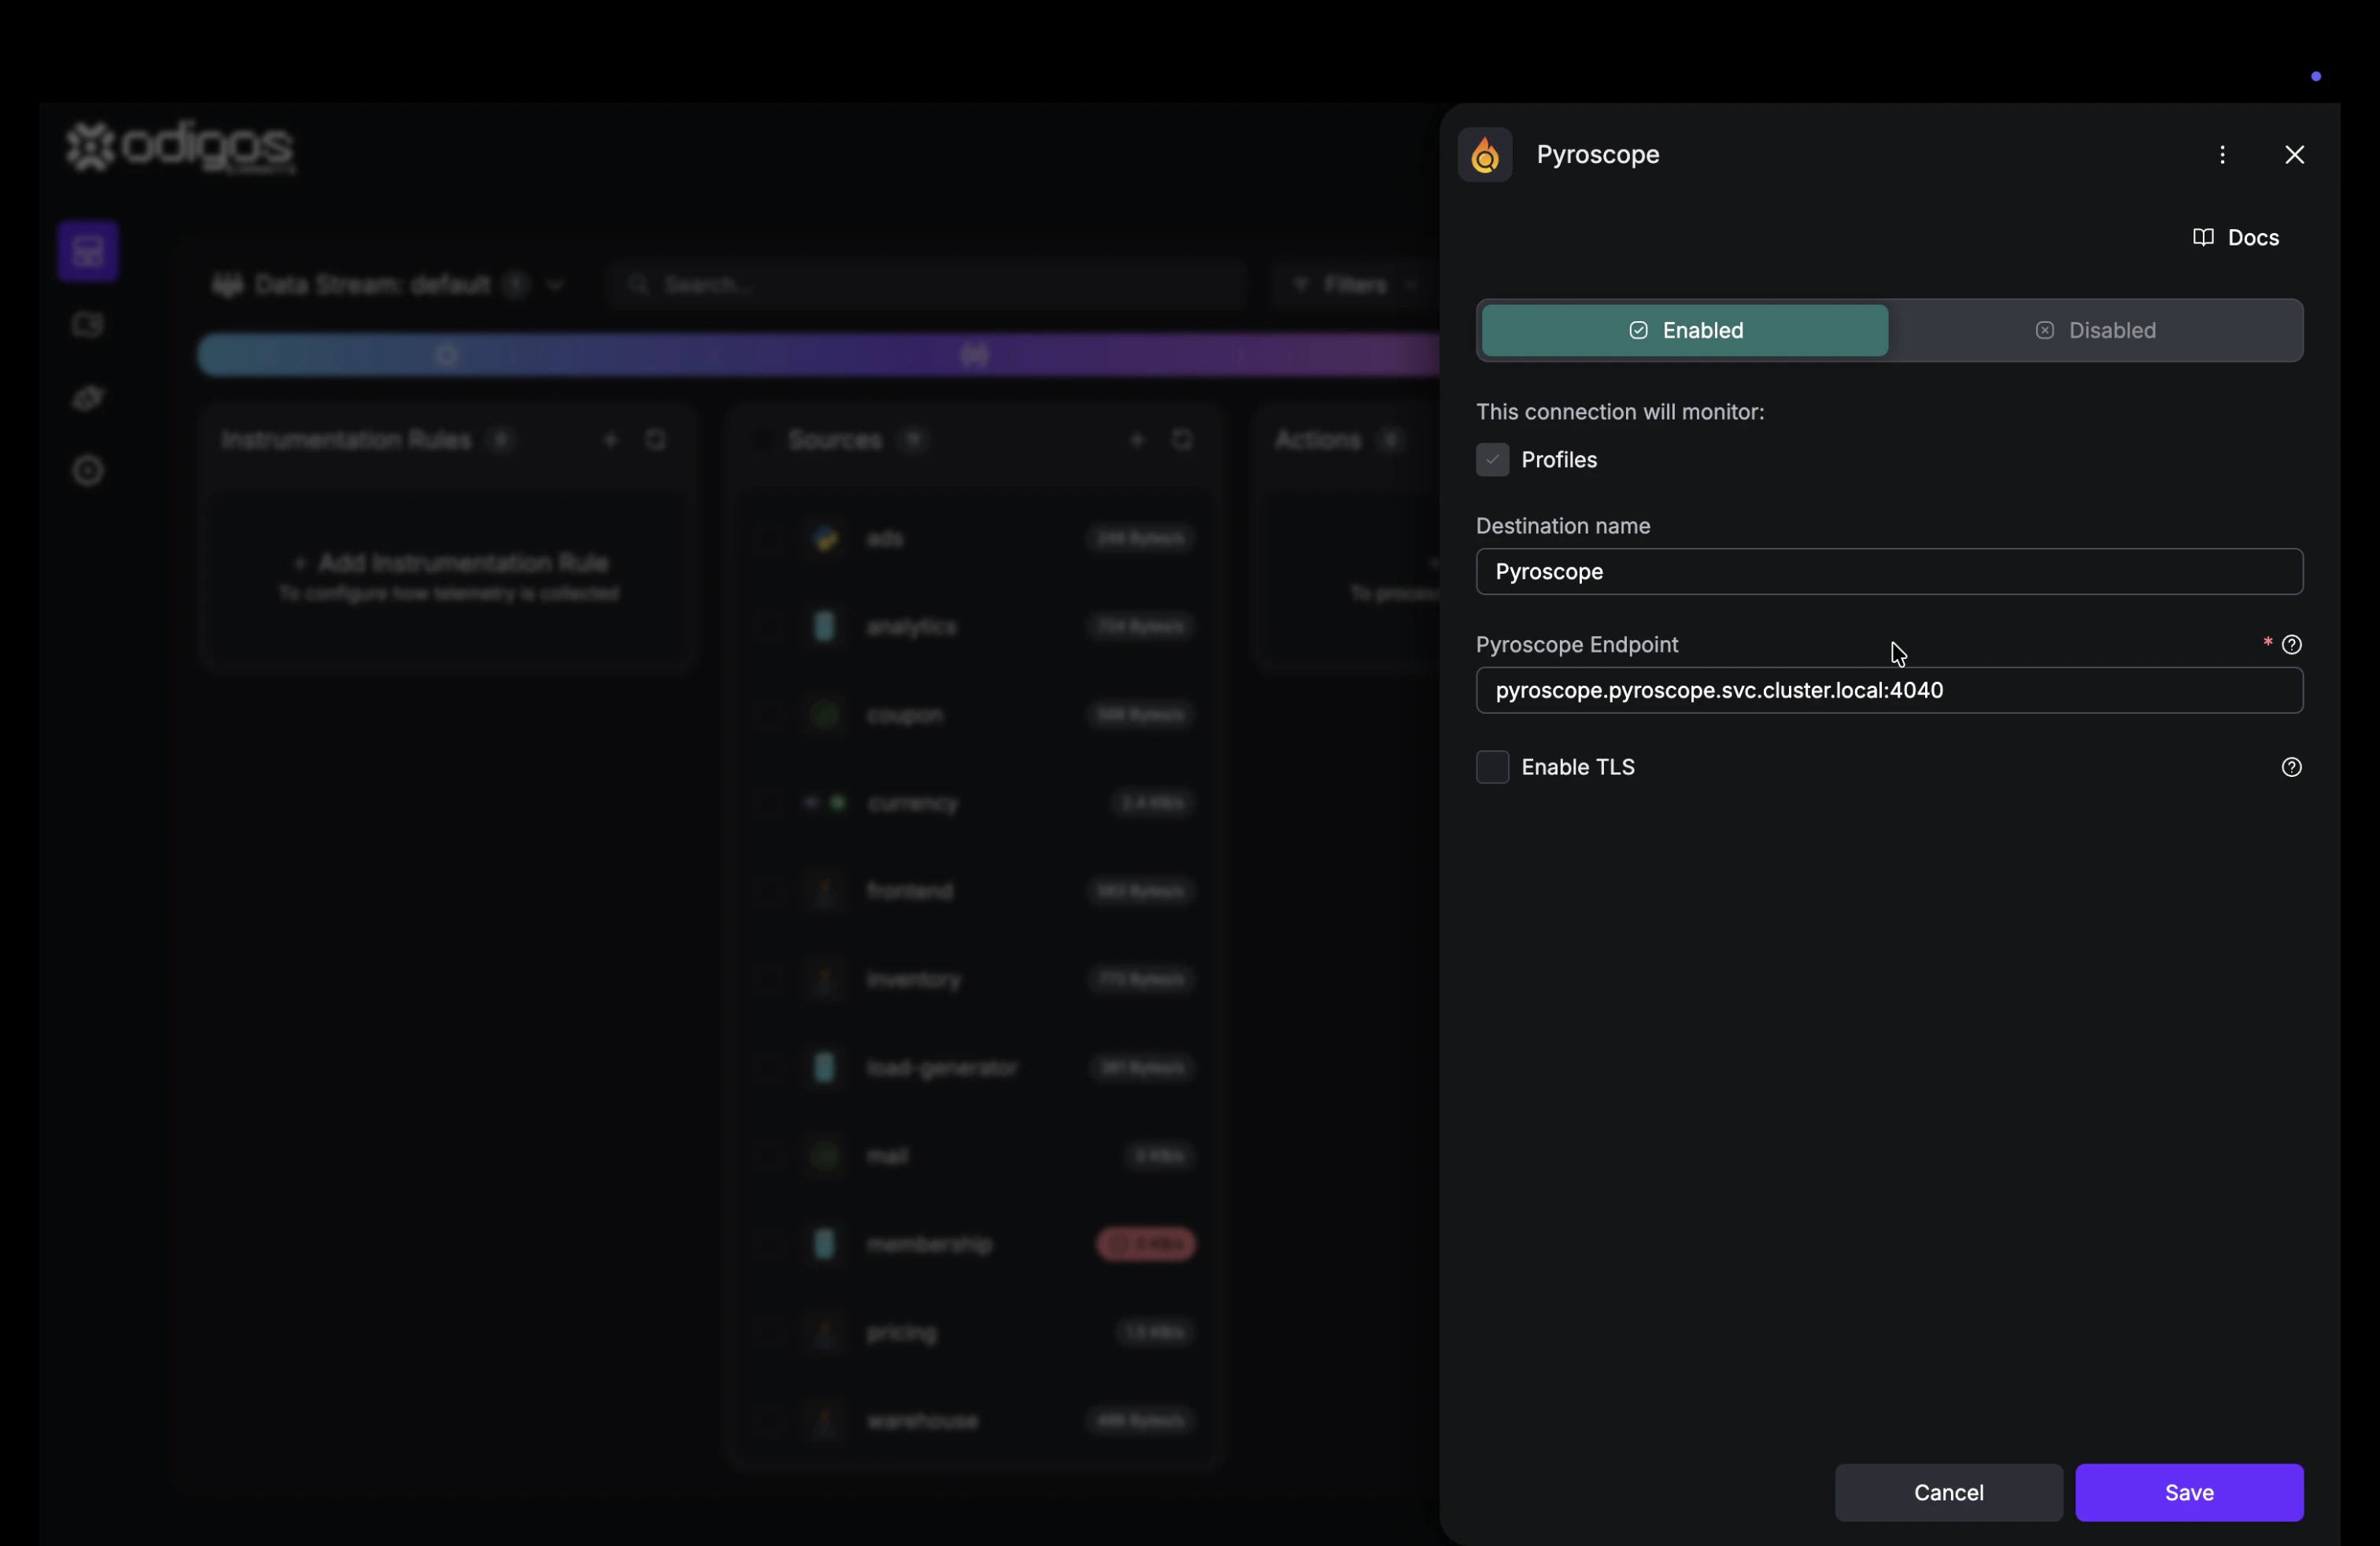
3
Configure the Pyroscope endpoint
Set Pyroscope URL to the distributor HTTP API as 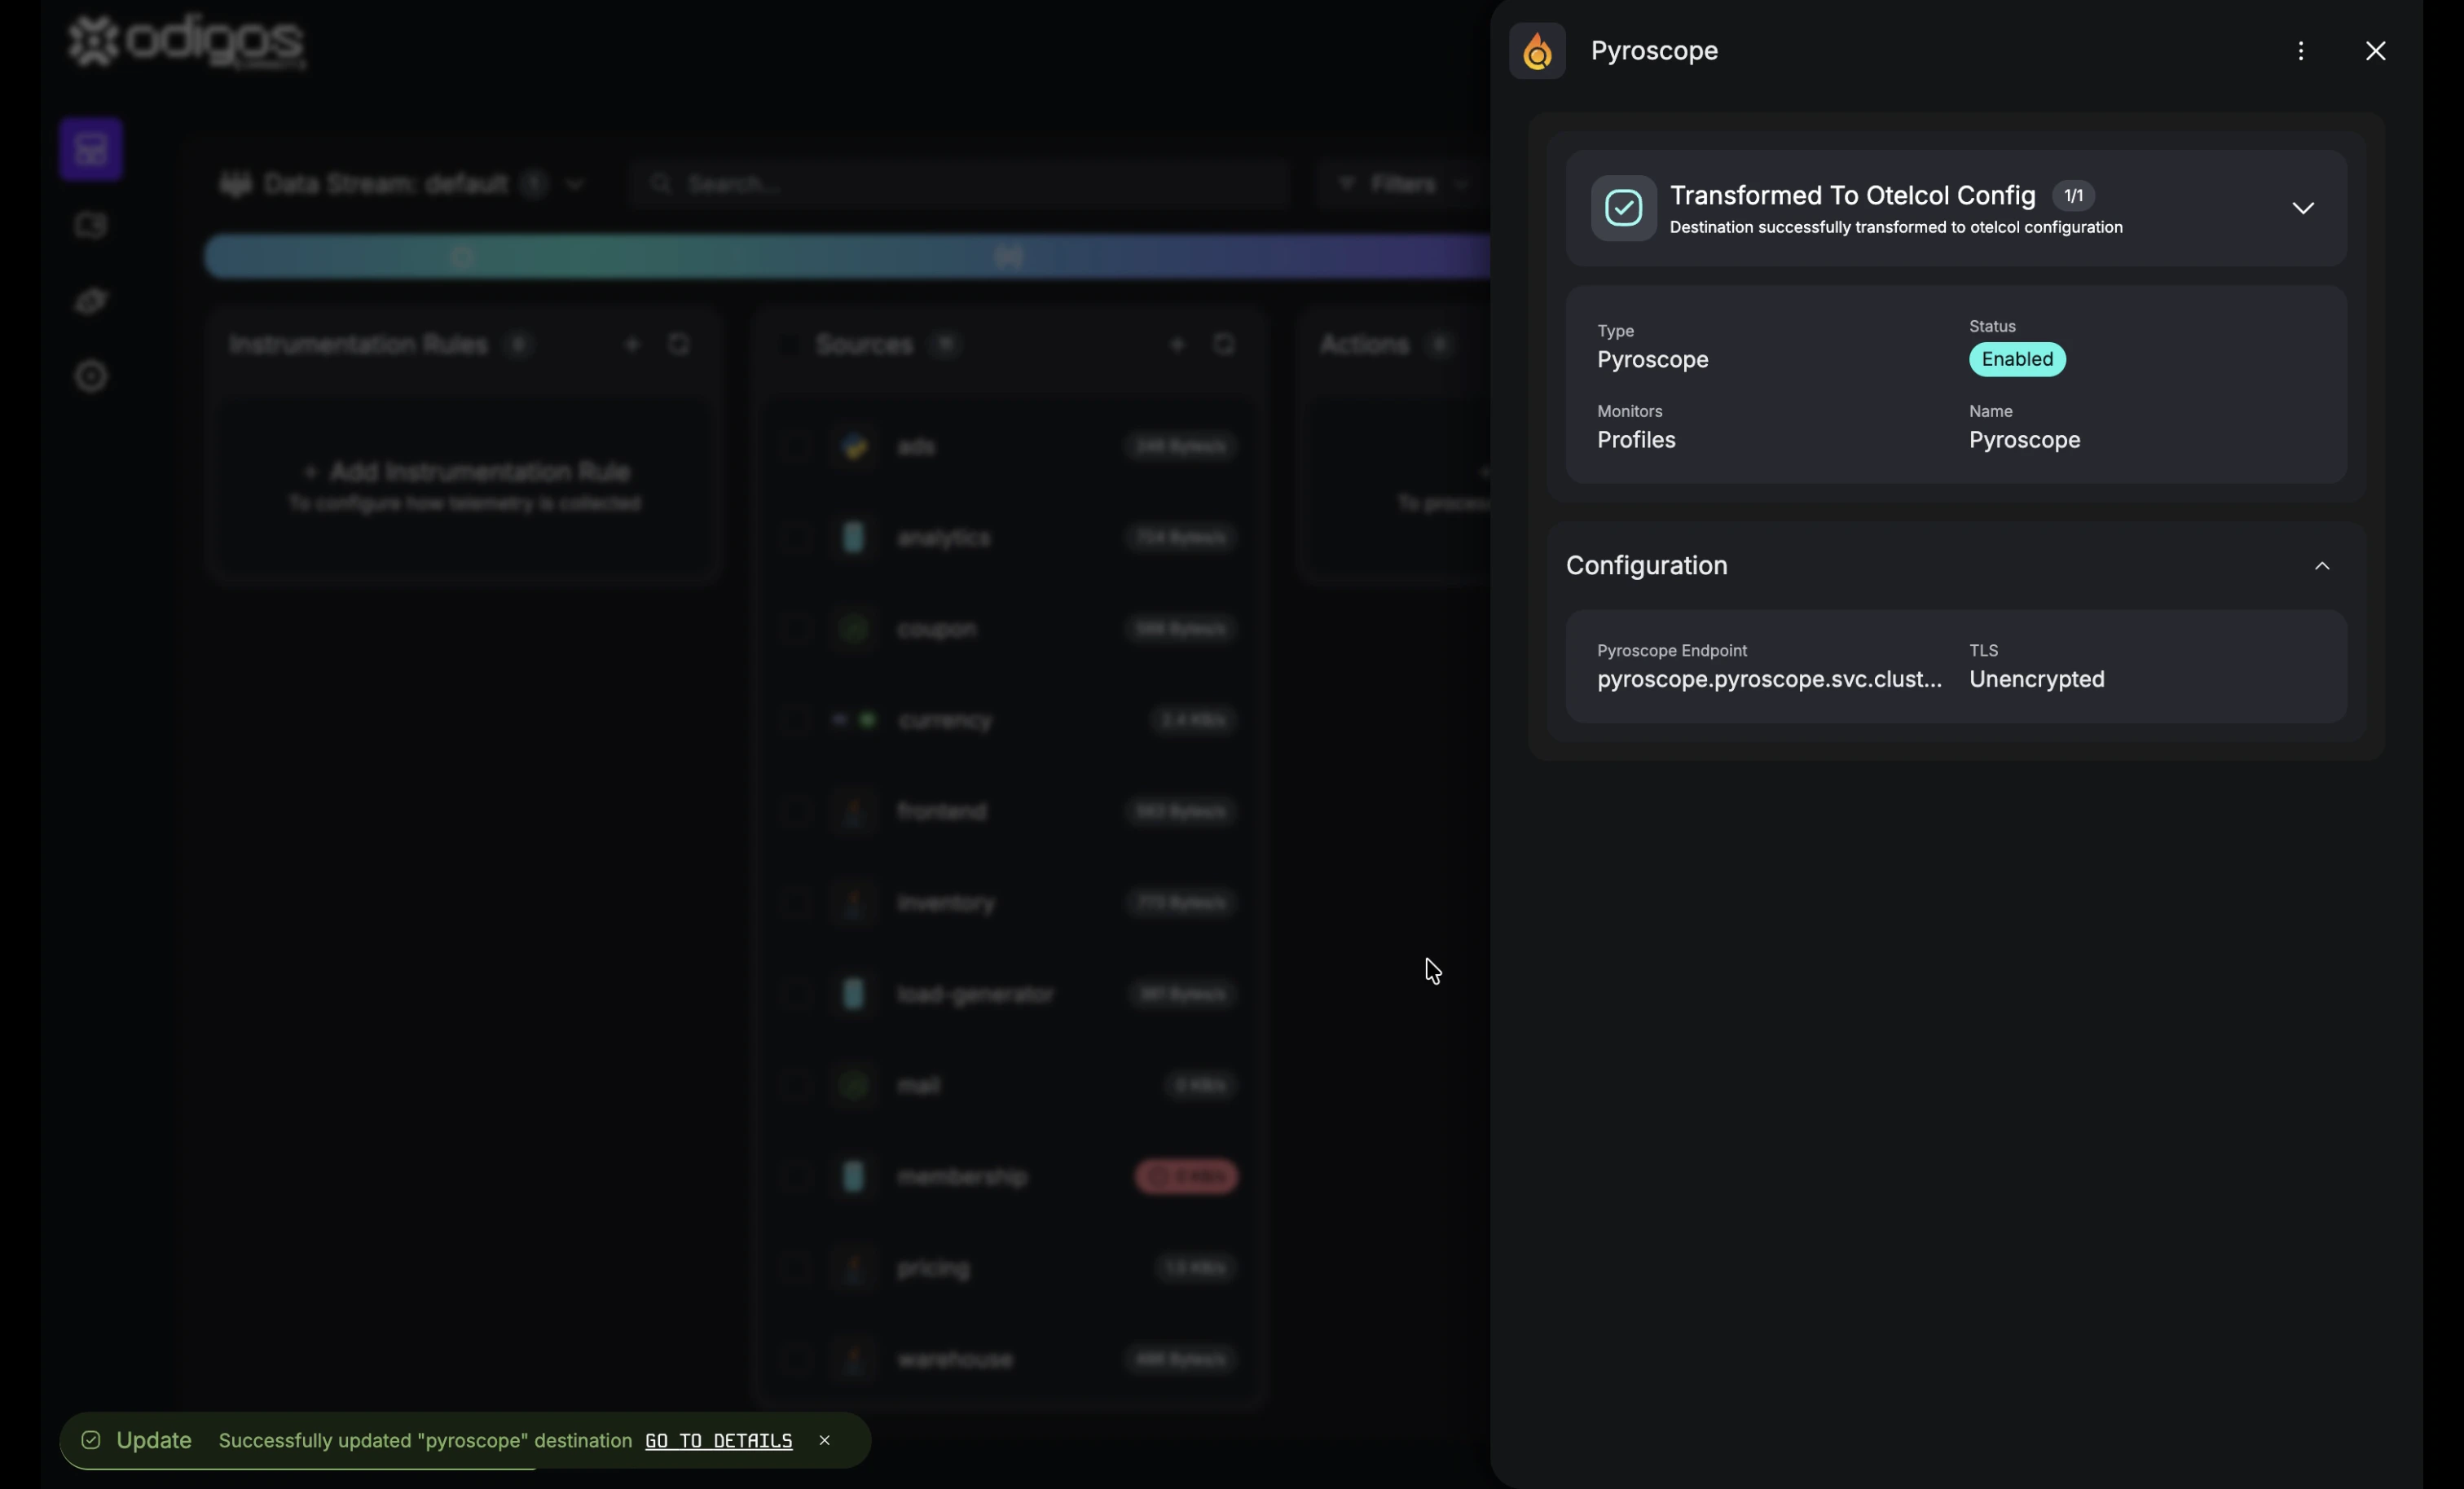
host:port (for example pyroscope.pyroscope:4040). Do not add an /otlp prefix—Odigos sends OTLP Profiles to the path Pyroscope expects on that host.4
Confirm profiles in Pyroscope
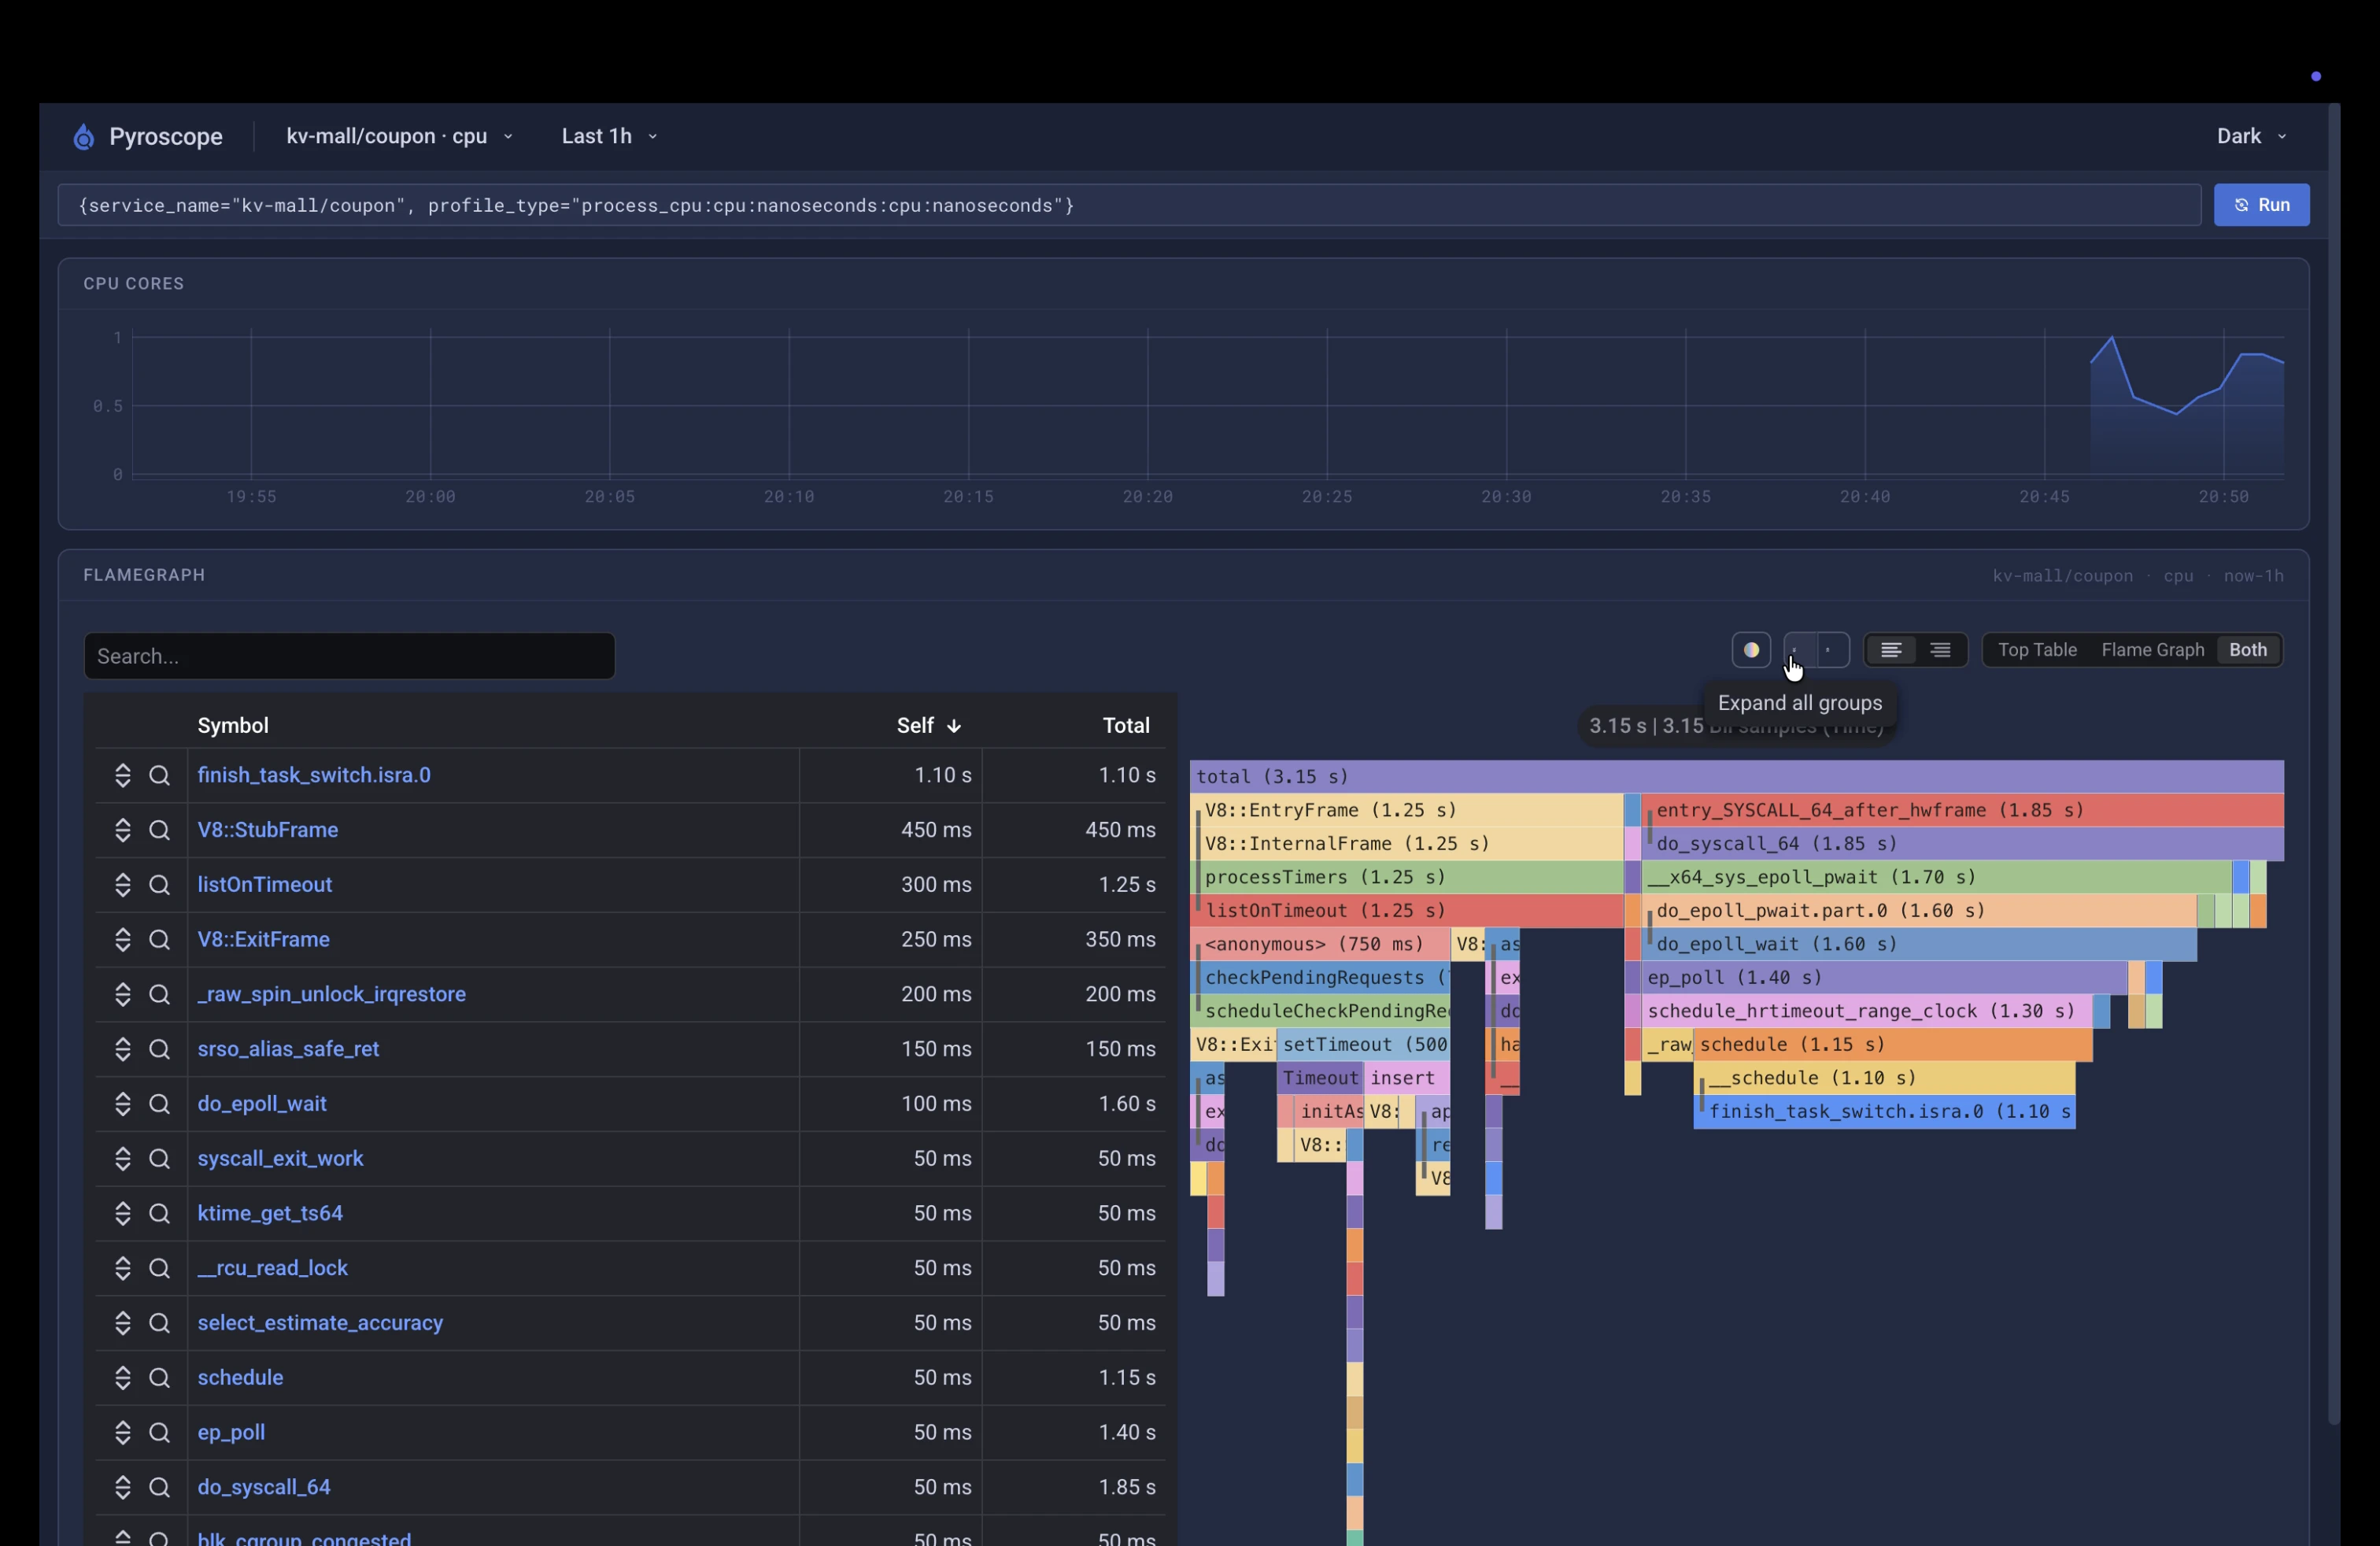
After the gateway picks up the destination, open Pyroscope and confirm profile data for your services. Export does not depend on having a profiling slot open in the Odigos UI.