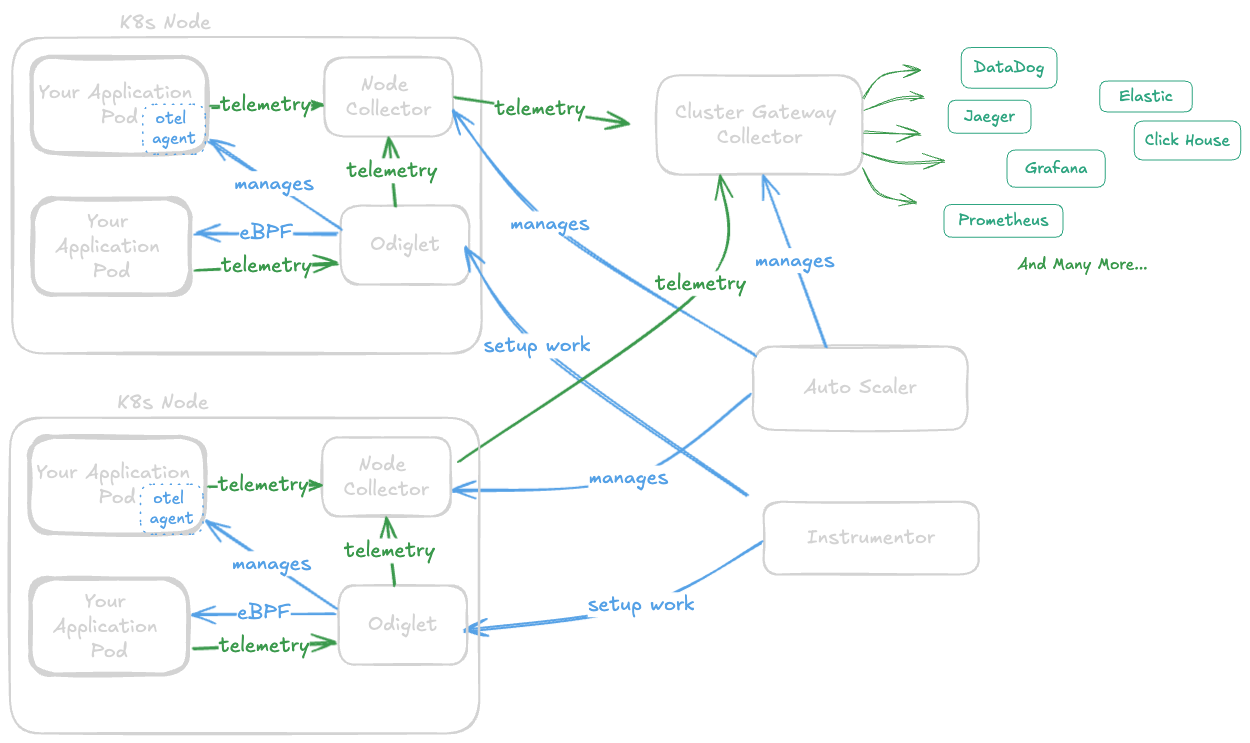
High Level Architecture
- Instrumentations - code that records OpenTelemetry signals from your application. It can be code in your application native programming language or eBPF programs that record OpenTelemetry data from the linux kernel.
- OpenTelemetry SDK - a library that runs in each instrumented process. It receives the OpenTelemetry data from instrumentations and export it out of the process boundary.
- Node Collector - also referred to as
data-collection collector. Each node in the cluster runs a single instance of this OpenTelemetry collector (DaemonSet). It receives the OpenTelemetry data from the OpenTelemetry SDKs, process it, and exports it to the next component in the pipeline. - Cluster Gateway Collector - a collector that runs as a k8s Deployment. It receives the OpenTelemetry data from the Node Collectors, process it, and export it to the next component in the pipeline.
Component types:
- Kubernetes Operators - reconcile the desired state of cluster resources and deploy / configure the necessary components.
- DaemonSets - perform node-level tasks, such as interacting with a process running on the node OS, accessing the Kubelet, and reading logs from the node filesystem.
- Deployments - run cluster-level components like the OpenTelemetry Collector and the Odigos UI.
Component Segments
Odigos is divided into three main segments:-
Instrumentation
- Inject OpenTelemetry agents to collect the instrumentation data from Odigos sources (instrumented applications)
- Record and report runtime information from the process environment that is relevant to instrumentation
- Export collected telemetry to the pipeline.
-
Pipeline
- Offload common or heavy tasks from the instrumented application runtime
- Apply Odigos Actions on the telemetry data
- Batch and send the telemetry data to the configured destinations
-
Odigos Management
- orchestrate the pipeline and the instrumentation based on the user’s configuration and cluster state,
- provide a UI for the odigos control plane.
Pipeline
Auto Scaler (Pipeline Manager)
Type: Auto scaler is a Kubernetes operatorRole: The auto scaler component is responsible for managing the OpenTelemetry Collectors which implement the OpenTelemetry pipeline.
K8s Resource:
kubectl get deployments -n odigos-system odigos-autoscaler
- Start and stop Collectors when needed (e.g. when sources or destinations are added or removed).
- Schedule the node collector to start only after the cluster collector is ready.
- Generate the configuration for the Collectors based on Odigos sources, destinations, and Actions.
Cluster Collector (Gateway Collector)
Type: Cluster collector is a deployment of the OpenTelemetry collectorRole: The cluster collector receives and processes all telemetry collected in the cluster, applies Actions, and exports data to the configured destinations.
K8s Resource:
kubectl get deployments -n odigos-system odigos-gateway
- Batch telemetry data for better performance and export it to the configured destinations
- Modify the telemetry data based on the Odigos Actions.
- Apply tail sampling based on the Odigos Actions to reduce the volume of data sent to the destinations.
- Collect metrics about the entities and report it to the UI for monitoring.
- Offload tasks from the agents, to reduce the overhead on the workload runtime environment
- Centralize any common processing that can be shared across multiple agents.
Node Collector
Type: Node collector is a daemon set and will run one pod per node in the clusterRole: The Node Collector (in the context of Pipeline component) receives telemetry data from agents running on the node, enriches it with node-level attributes, and forward it efficiently and reliably to the cluster collector.
K8s Resource:
kubectl get daemonsets -n odigos-system odigos-data-collection
- Receive telemetry data from agents running on the node (Odiglet for eBPF based agents, and instrumentation processes for native OpenTelemetry agents).
- Add node-level attributes to the telemetry data (
k8s.node.name, cloud attributes, etc). - Batch and send telemetry data to the Cluster Collector, offloading any network overhead from the instrumented application runtime.
The Node Collector is also responsible for recording some k8s metrics, and collecting the generated logs from the node fs. Read more Under the Instrumentation section.
Instrumentation
Instrumentor (Auto Instrumentation Agent Manager)
Type: Instrumentor is a Kubernetes operatorRole: The Instrumentor is responsible for managing auto instrumentation agents which collect telemetry data from Odigos sources.
K8s Resource:
kubectl get deployments -n odigos-system odigos-instrumentor
- Create and manage
instrumentationconfig.odigos.ioobjects- Trigger Odiglet to inspect runtime information of workloads.
- Trigger Scheduler to deploy the Odigos pipeline.
- Merge Odigos instrumentation rules and config to a workload scope configuration for the agent.
- Inject the instrumentation device into the workload manifest resource as virtual device.
- Monitor the
source.odigos.ioCRD and cleanup any instrumentation related resources when a source is removed.
Odiglet
Type: Odiglet is a daemon set and will run one pod per node in the clusterRole: Odiglet sets up the node environment to run telemetry collection agents.
K8s Resource:
kubectl get daemonsets -n odigos-system odiglet
- Inspect container runtime details of instrumented sources (to determine programming language, relevant environment variables, runtime versions, etc).
- Implement the Kubernetes virtual instrumentation devices. In the presence of a supported device on the pod, Odiglet will mount the agent code from file system to the pod and add the relevant environment variables to initiate instrumentation.
- For eBPF-based instrumentation, Odiglet will inject the eBPF code into the pod, pick up telemetry from eBPF, and push it downstream to the Node Collector.
- Monitor for config changes to instrumentations and update the relevant agents accordingly at runtime.
Node Collector
Role: Node collector (in the context of instrumentation) is responsible for scraping Kubernetes metrics, and collect logs from the node filesystem.- When a metrics destination exists, the node collector will use the OpenTelemetry Collector “kubeletstats receiver” to scrape k8s related metrics from the Kubelet and export them as OpenTelemetry metrics to the cluster collector.
- When a logs destination exists, the node collector will use the OpenTelemetry Collector “filelog receiver” to read the relevant pod logs from the node filesystem and export them as OpenTelemetry logs to the cluster collector.
Odigos
Odigos UI
Type: Odigos UI is a web application backed by a deployment in the cluster and accessible by the user’s browser.Role: The Odigos UI is a web application that allows users to configure various aspects of the Odigos installation.
K8s Resource:
kubectl get deployments -n odigos-system odigos-ui
- Serve as web server for the Odigos UI
- Serve static files to the frontend
- Provide a GraphQL API for the frontend, which in turn interacts with Kubernetes API to manage the Odigos installation.
- Provide a user interface for monitoring and managing the Odigos installation, including the sources, destinations, actions, and instrumentation rules.
- Examine the current state of Odigos and show any errors.
Scheduler
Type: Scheduler is a Kubernetes operatorRole: The scheduler is responsible for managing the Odigos installation itself.
K8s Resource:
kubectl get deployments -n odigos-system odigos-scheduler
- Monitor the Odigos sources and destinations to trigger deployment of the Odigos pipeline.
- Reconcile Odigos configuration to run validations, set defaults, and apply Odigos Profiles (configuration presets) to the cluster.