

opentelemetry-ebpf-instrumentation distro is selected or a Metrics InstrumentationRule is configured.
OpenTelemetry OBI
Upstream concepts, requirements, and capabilities.
OBI on GitHub
Source, releases, and issues.
Traces
OBI tracing can be enabled by selecting it as a container override for specific workloads. This can be configured either from the Odigos UI or directly on a Source object.Enabling OBI from the UI
1
Open the source drawer and edit the detected container
Select the source you want to instrument. In the source drawer, click the edit (pencil) icon next to the
detected container.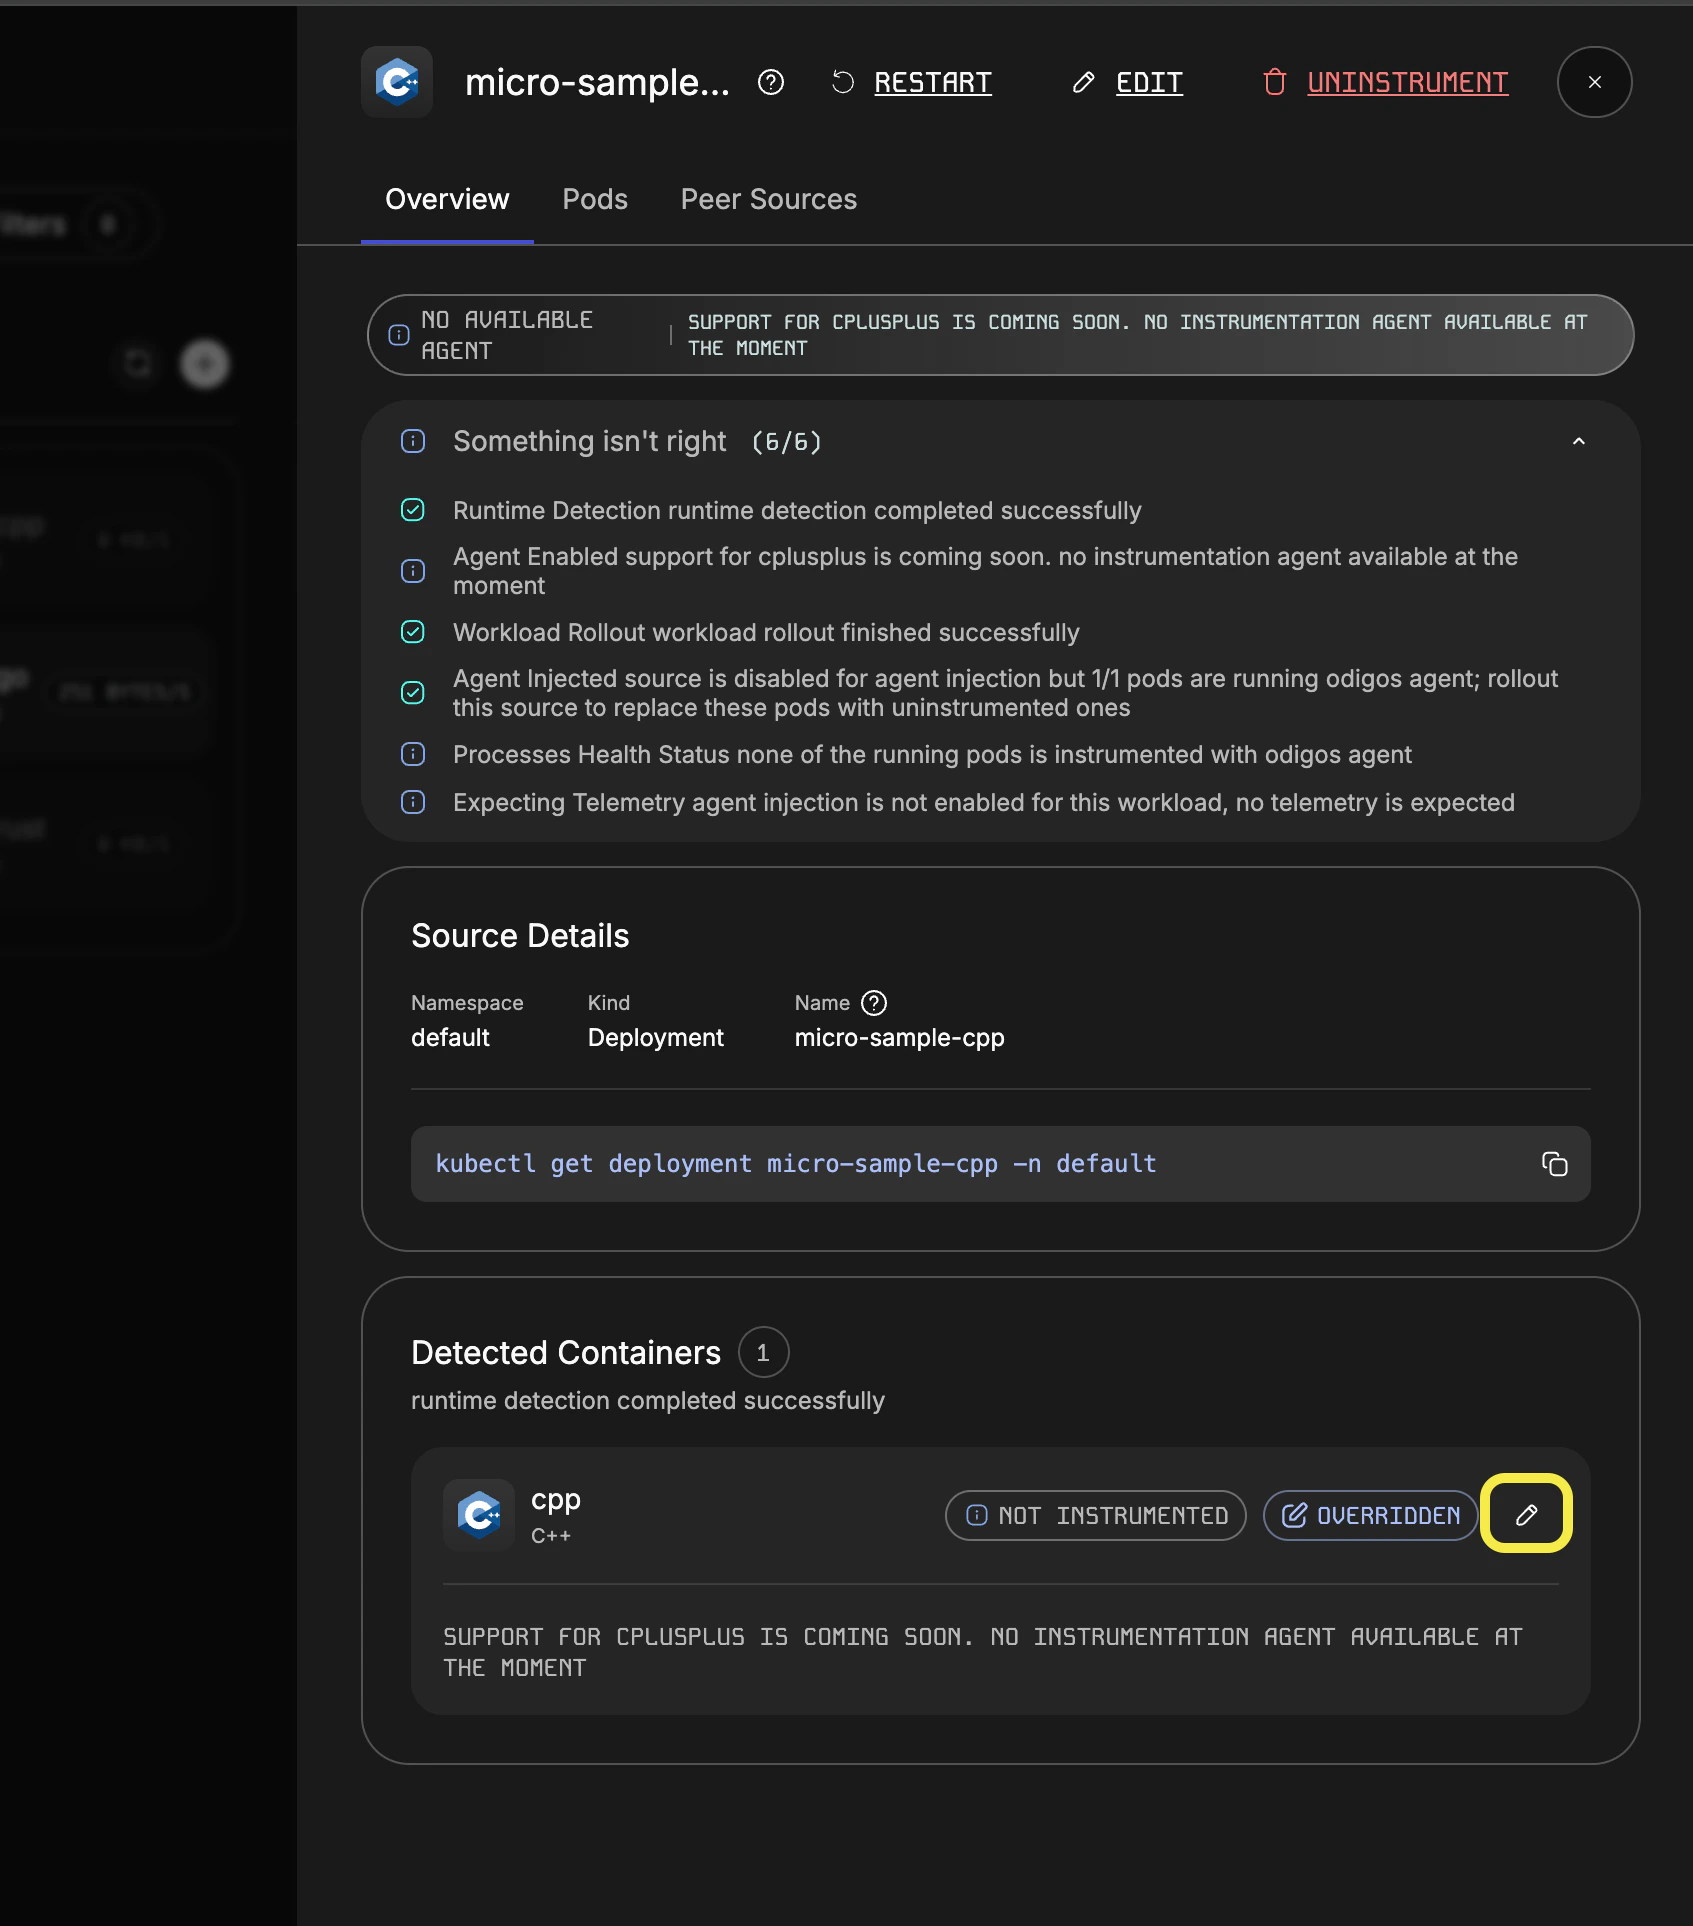
2
Choose the opentelemetry-ebpf-instrumentation distro
In the Otel Distro Name drop-down, choose 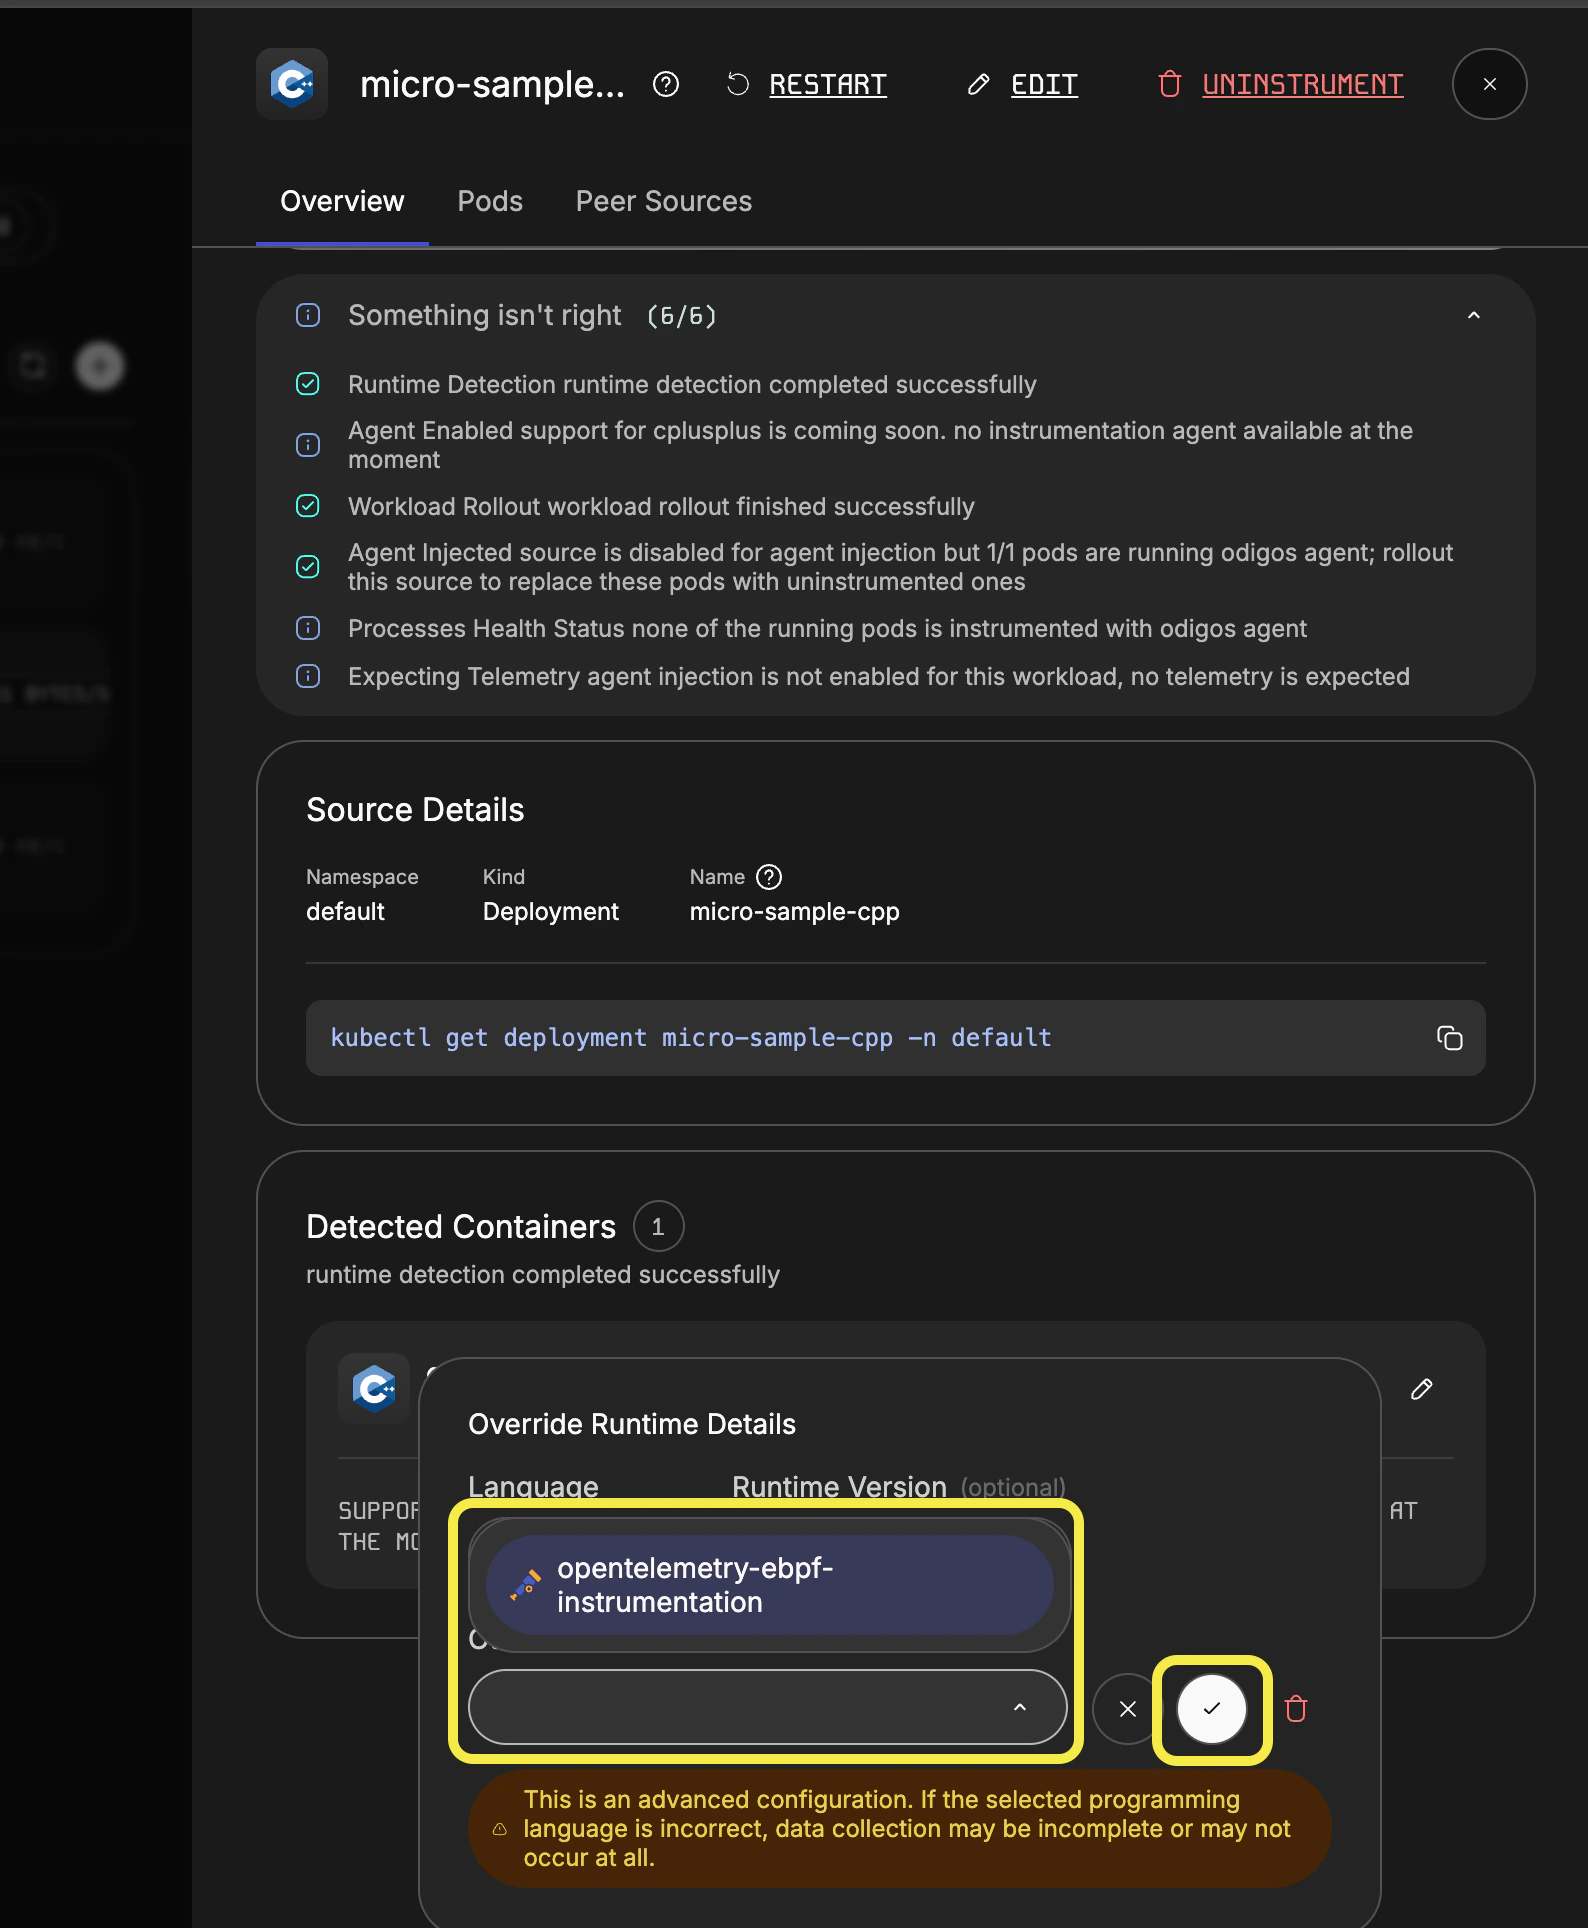
opentelemetry-ebpf-instrumentation and click the check
mark to save.3
Verify the source is instrumented with OBI
After refreshing, the detected container should report that it is instrumented with
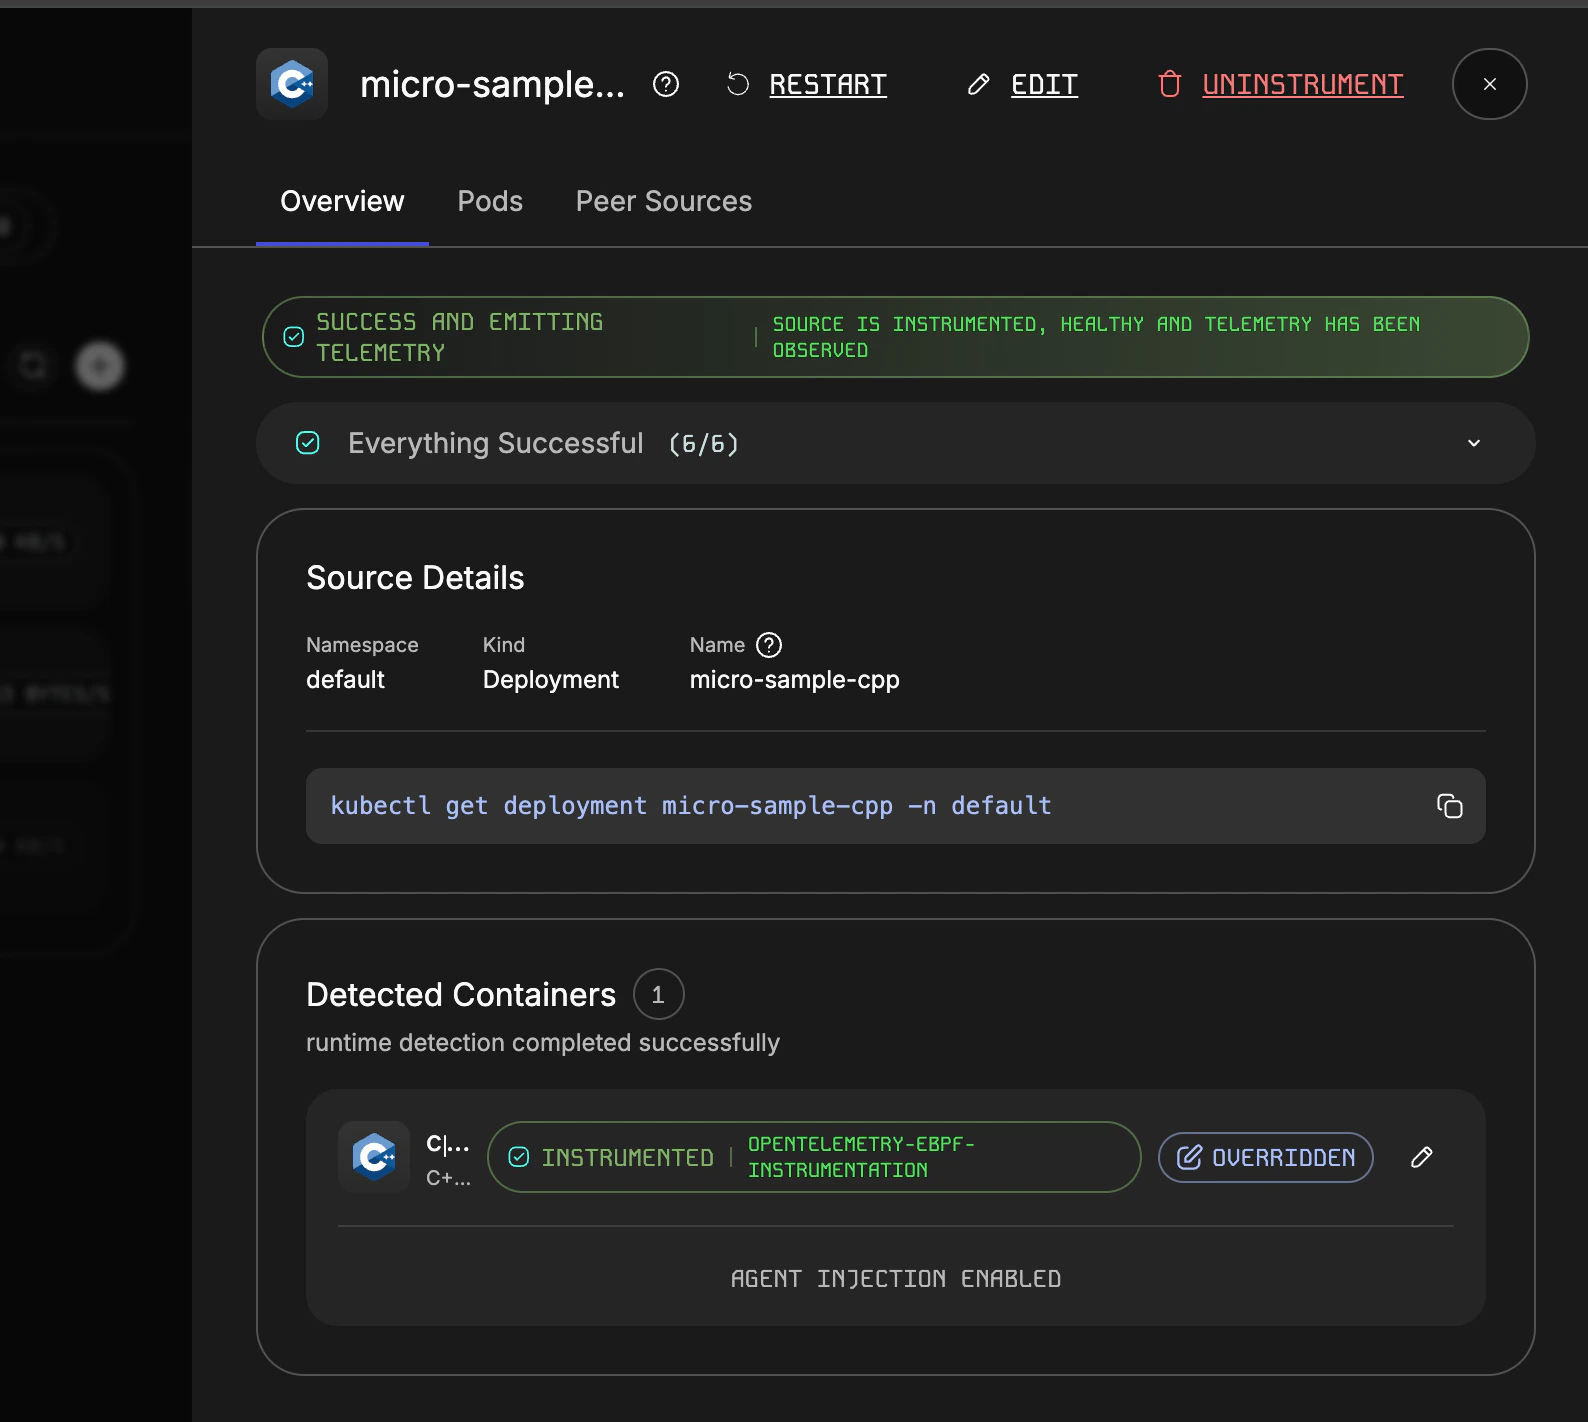
opentelemetry-ebpf-instrumentation.4
Remove OBI instrumentation
To remove OBI instrumentation, open the runtime override config again and click the delete (trash) icon
next to the Otel Distro Name field.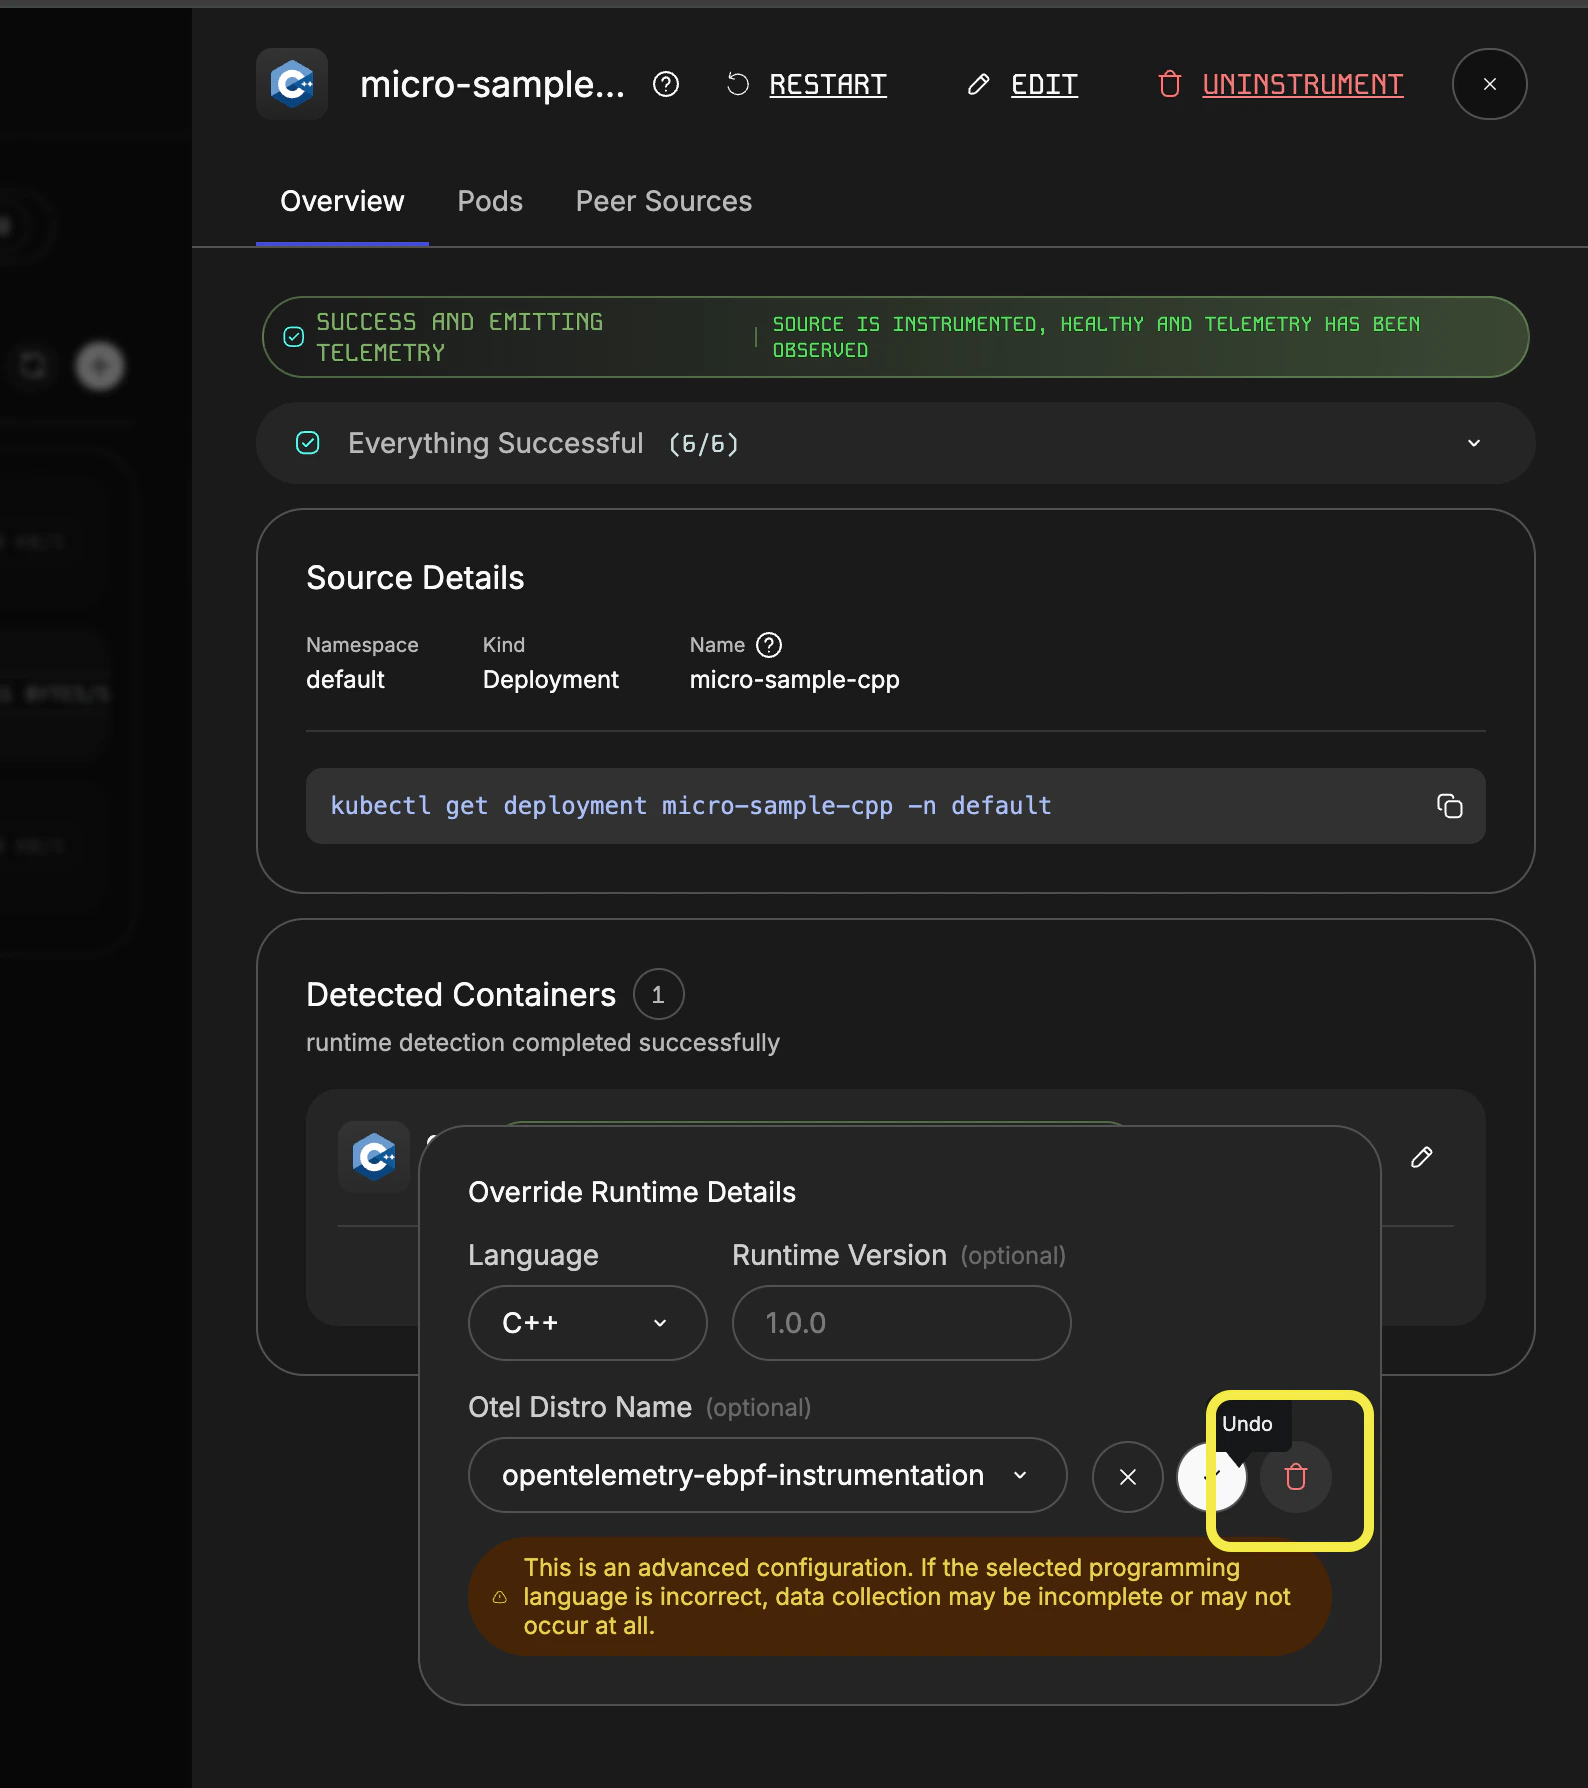
By default, OBI does not need to restart your containers to begin instrumenting them. Because of this,
choosing OBI as your container override will not trigger a pod restart. In some cases, however, your
specific application may still require a pod restart (for example, when switching from a pre-existing
instrumentation to OBI or vice-versa). You can trigger a pod restart using the Restart button in the
source drawer.
Enabling OBI from a Source object
If editing a Source object directly, OBI is enabled through thecontainerOverrides field. For example:
containerName is the name of the container to instrument in this workload, and the required
otelDistroName is opentelemetry-ebpf-instrumentation.
Trace support
When OBI is the selected distro, odiglet attaches the process to OBI’s trace selector when instrumentation loads and removes it when instrumentation stops. OBI captures distributed traces for supported protocols (HTTP, gRPC, databases, messaging, and more) without code changes. DNS lookup traces are enabled by default when using the OBI distro. Learn more in the upstream docs:Distributed traces
Context propagation, compatibility, and Kubernetes requirements.
Supported protocols
Protocol, database, messaging, and Go library instrumentation coverage.
context_propagation: headers). For encrypted traffic and
multi-service propagation limits, see the upstream distributed tracing guide linked above.
Limitations
OBI’s instrumentation is based on HTTP header propagation. For encrypted traffic, context propagation will not work unless both workloads (client and server) are instrumented with OBI as explained in the official OBI docs.Metrics
Upstream OBI is split into several observability pipelines. In Odigos, each signal is wired independently so traces and metrics can be enabled without requiring the same distro or lifecycle on every process.
All OBI telemetry that Odigos collects is exported over OTLP to the odiglet node collector (
localhost:4317), then
follows the same Odigos pipeline as other workload telemetry.
For consistency and discoverability alongside other Odigos telemetry, the node collector rewrites the
obi prefix of OBI metric names to odigos. Metrics named obi.* are exported as odigos.* (and the
Prometheus form obi_* as odigos_*). For example, obi.network.flow.bytes is exported as
odigos.network.flow.bytes. Metric names referenced in the OBI documentation below use the obi
prefix; account for this rename when building dashboards or queries.Configuration
Network metrics infrastructure (cluster-wide): OBI network flow collection requires odiglethostNetwork. Enable the
infrastructure in Helm by setting metricsSources.networkMetrics.enabled to true (it defaults to disabled):
InstrumentationRule in the Odigos installation namespace (typically
odigos-system) with a networkMetrics block. See Network Metrics for configuration options,
examples, and verification steps.
Multiple rules merge with OR semantics (if any rule enables a signal, it is enabled). Workload scoping via scopes is
optional — omit it to apply cluster-wide.
Network metrics
Network metrics describe bytes sent and received between endpoints (pods, services, nodes, and related Kubernetes metadata), along with TCP-level statistics such as round-trip time and failed connection attempts. Enable cluster infrastructure withmetricsSources.networkMetrics.enabled: true, then enable collection with an
InstrumentationRule networkMetrics block (cluster-wide or scoped via scopes).
Network metrics overview
Flow and inter-zone metric families, attributes, and aggregation behavior.
Exported metric names
OpenTelemetry and Prometheus names for
obi.network.flow.bytes and related series.Stats metrics
Stats metrics (obi.stat.tcp.rtt, obi.stat.tcp.failed.connections, and related series) are collected together with network flow metrics when the Network Metrics rule is enabled.
Exported stats metrics
Metric names and attributes for
obi.stat.tcp.rtt, obi.stat.tcp.failed.connections, and related series.Metrics export features
How OBI groups metrics into
network, stats, stats_tcp_rtt, and related feature flags.