odictl or using YAML files.
- odictl
- YAML
1
Launch odictl
2
Select the actions menu
Use 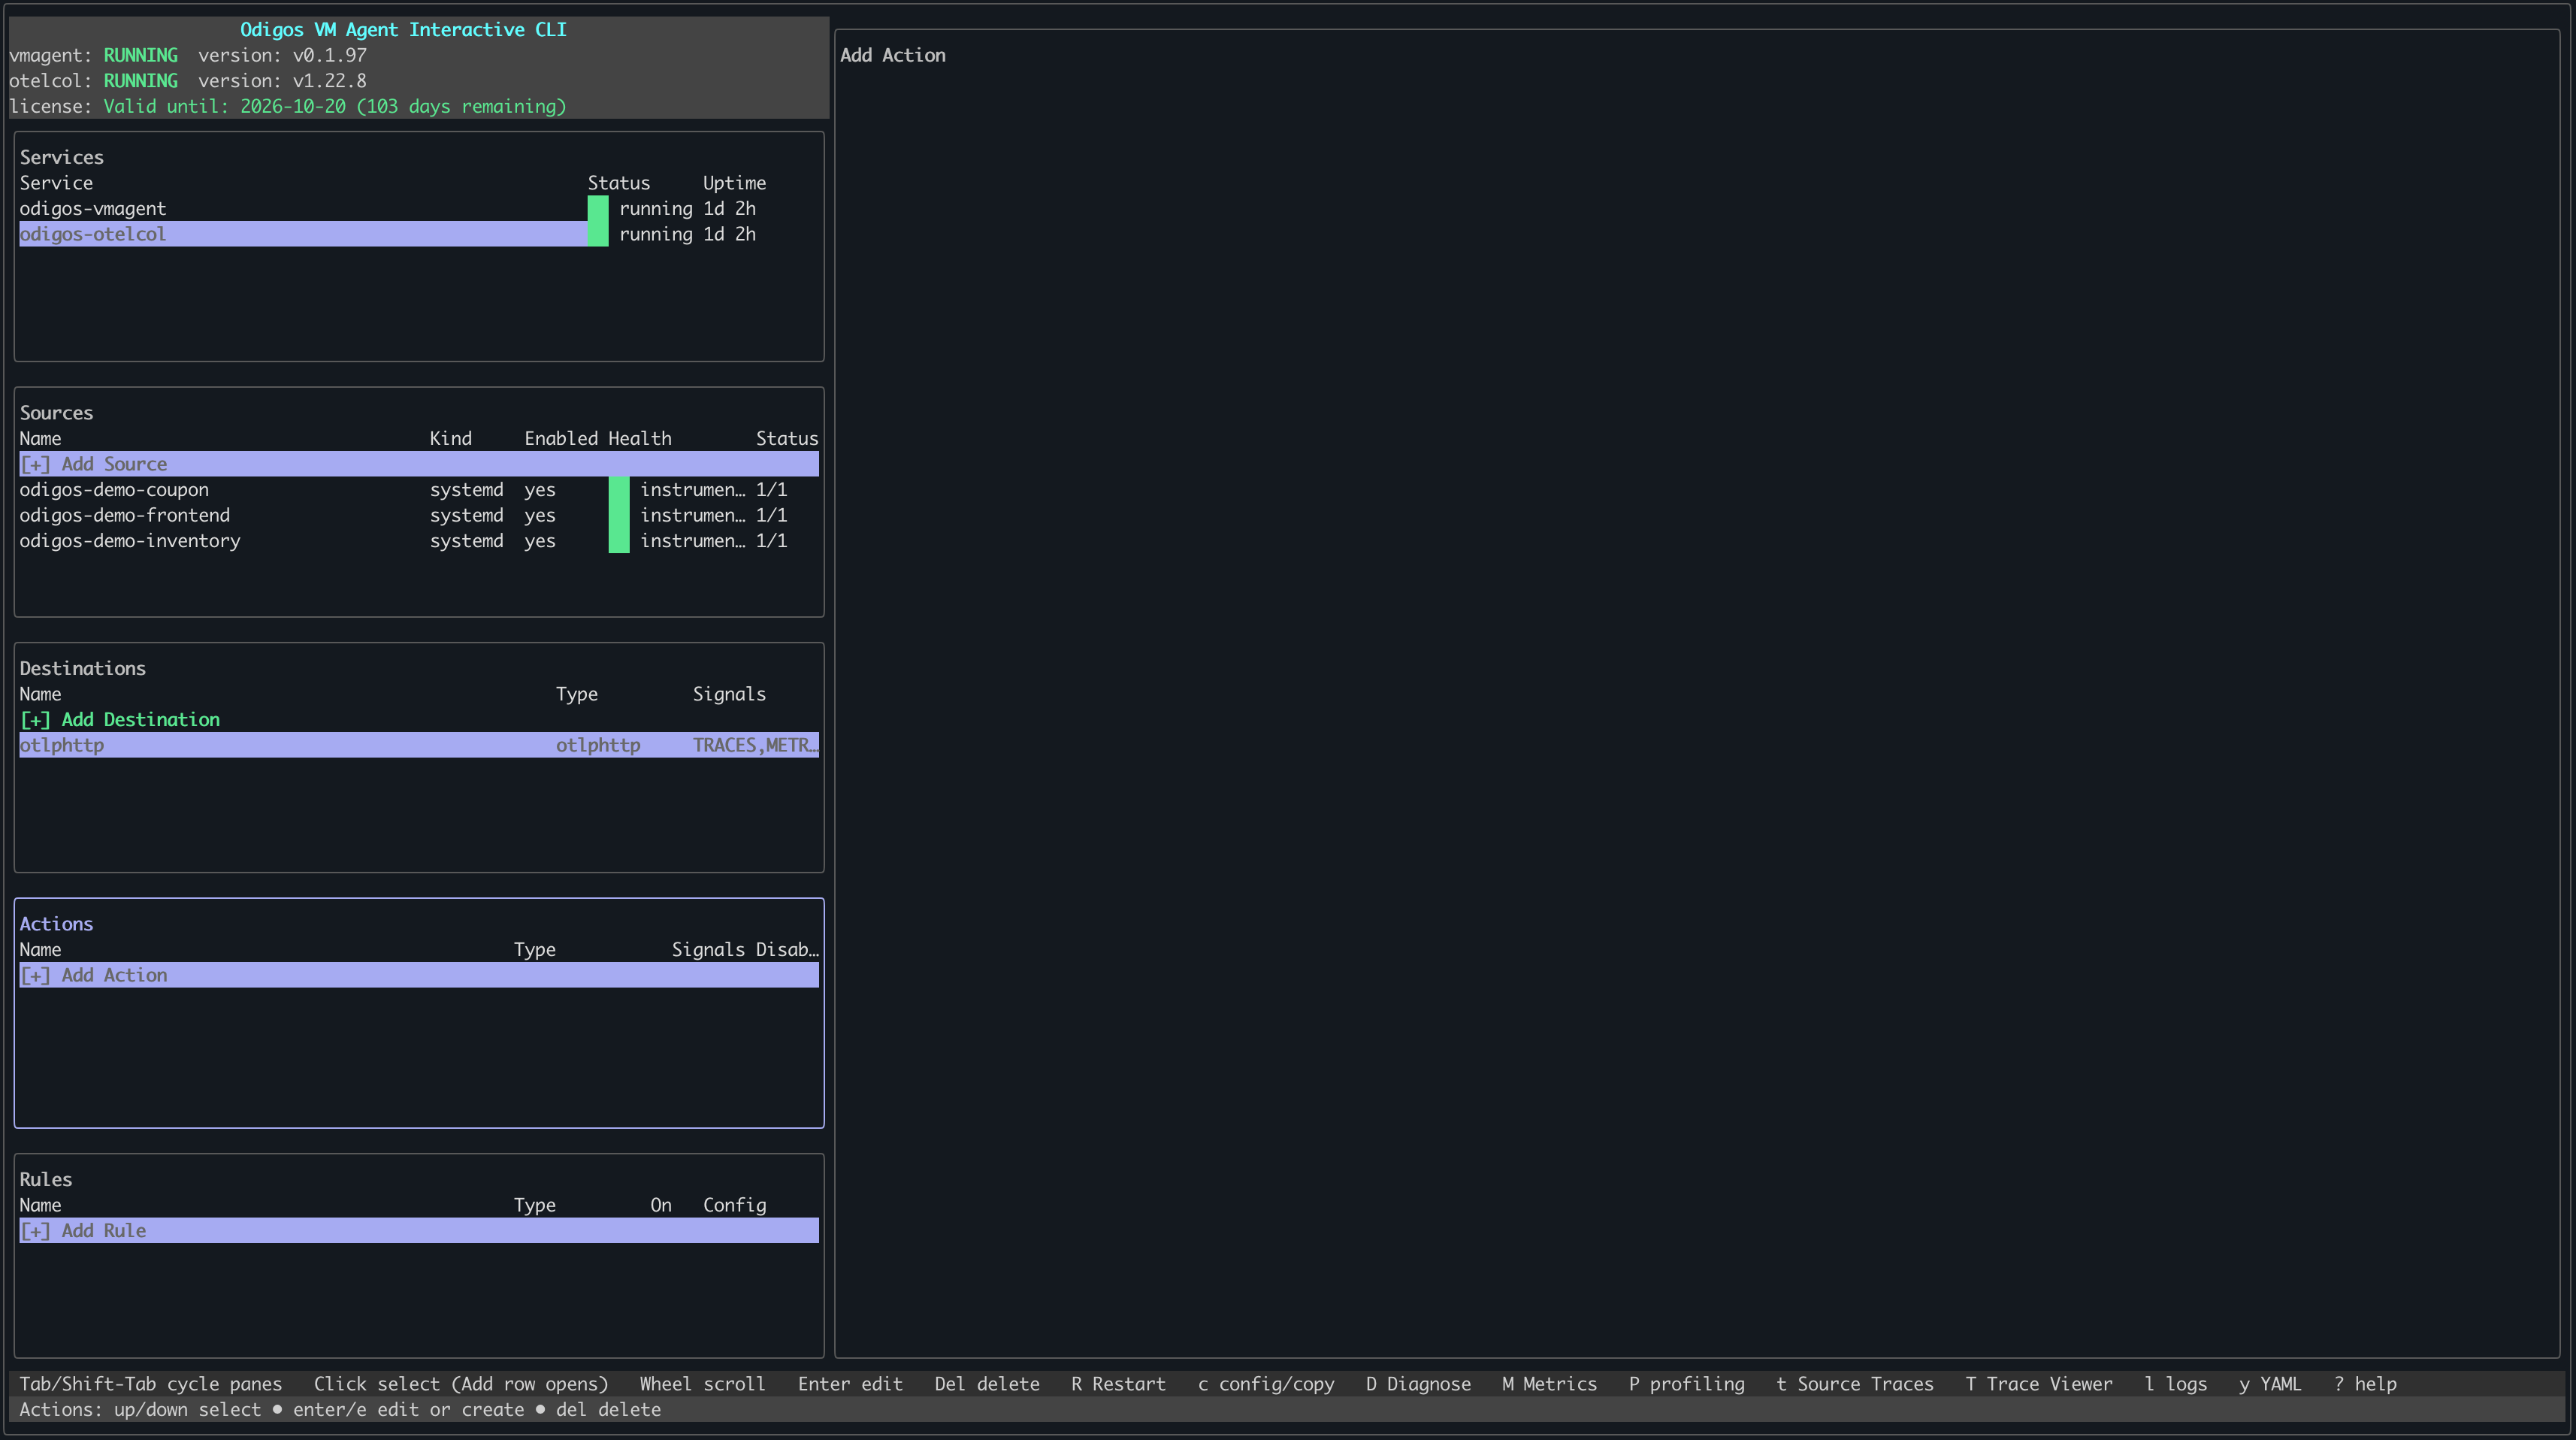
Tab to focus on the Actions pane or press a, then press Enter or click + Add Action with your mouse.3
Select Span metrics
Use the arrow keys to move through the list of action types. When Span metrics is highlighted, press 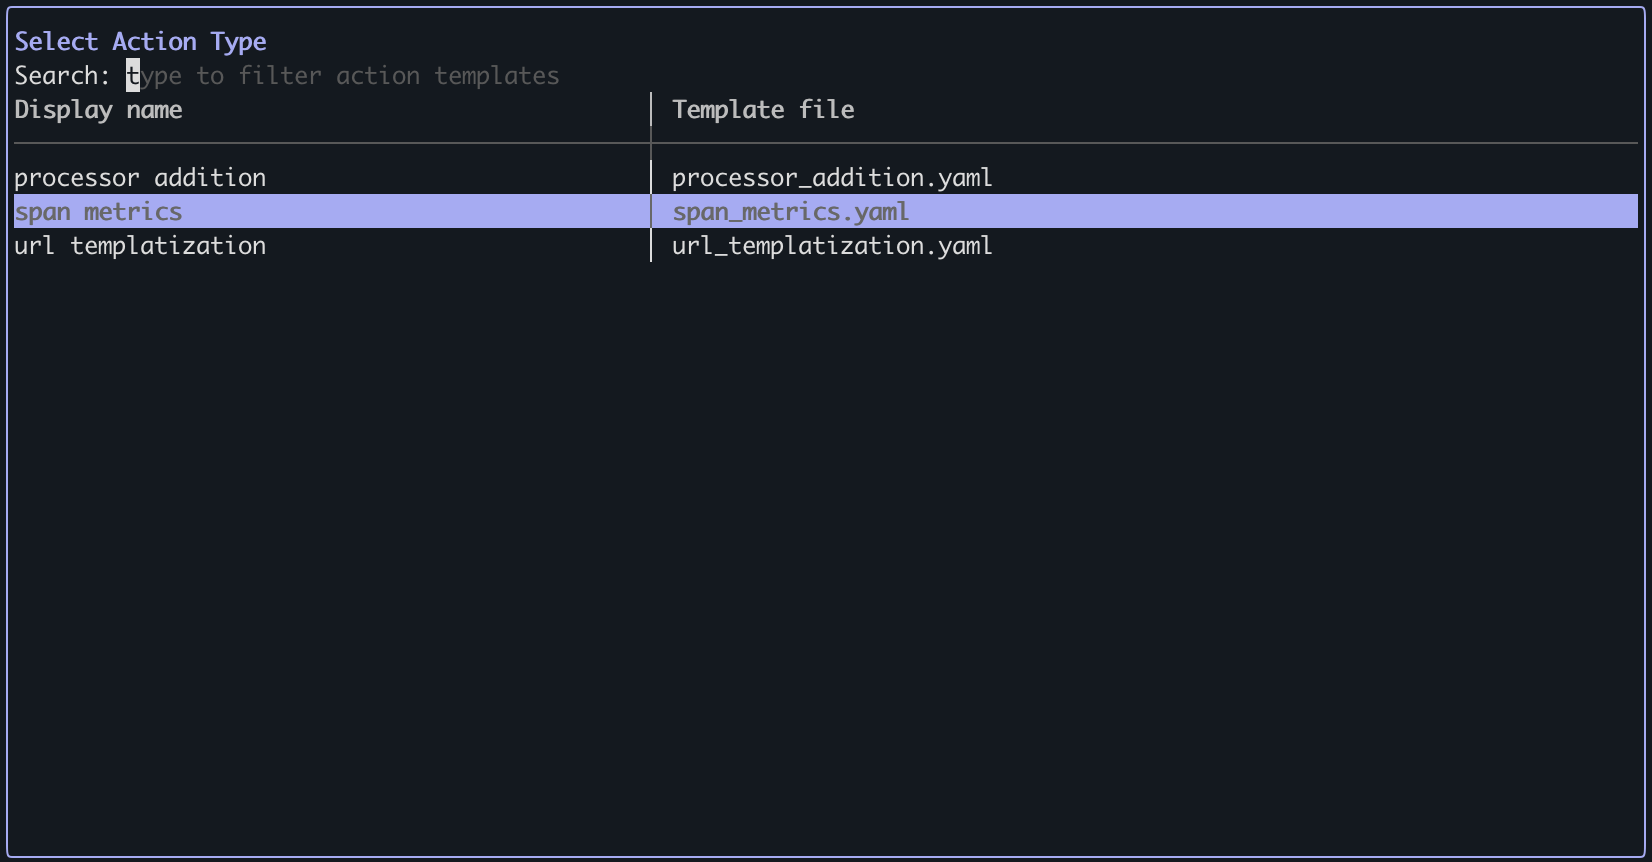
Enter.4
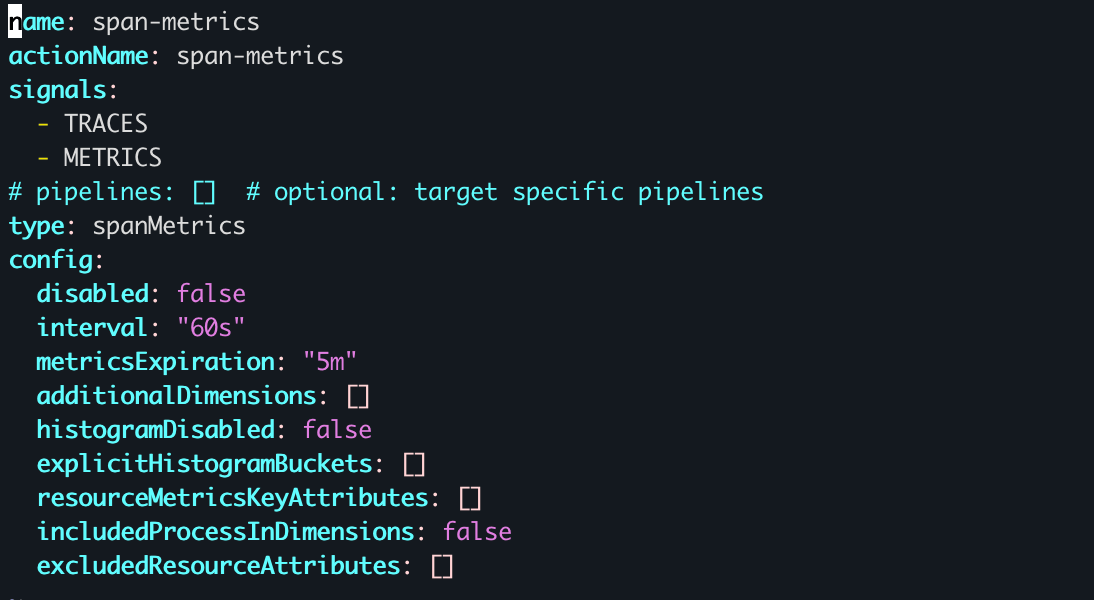
Configure span metrics
- Press
ito enter INSERT mode. - Adjust options such as
interval,metricsExpiration, and histogram settings as needed. - When finished, press
Esc, then type:wqto save and exit.
To cancel creating the action, press
Esc if you are in INSERT mode, then type :q! to exit without saving.5
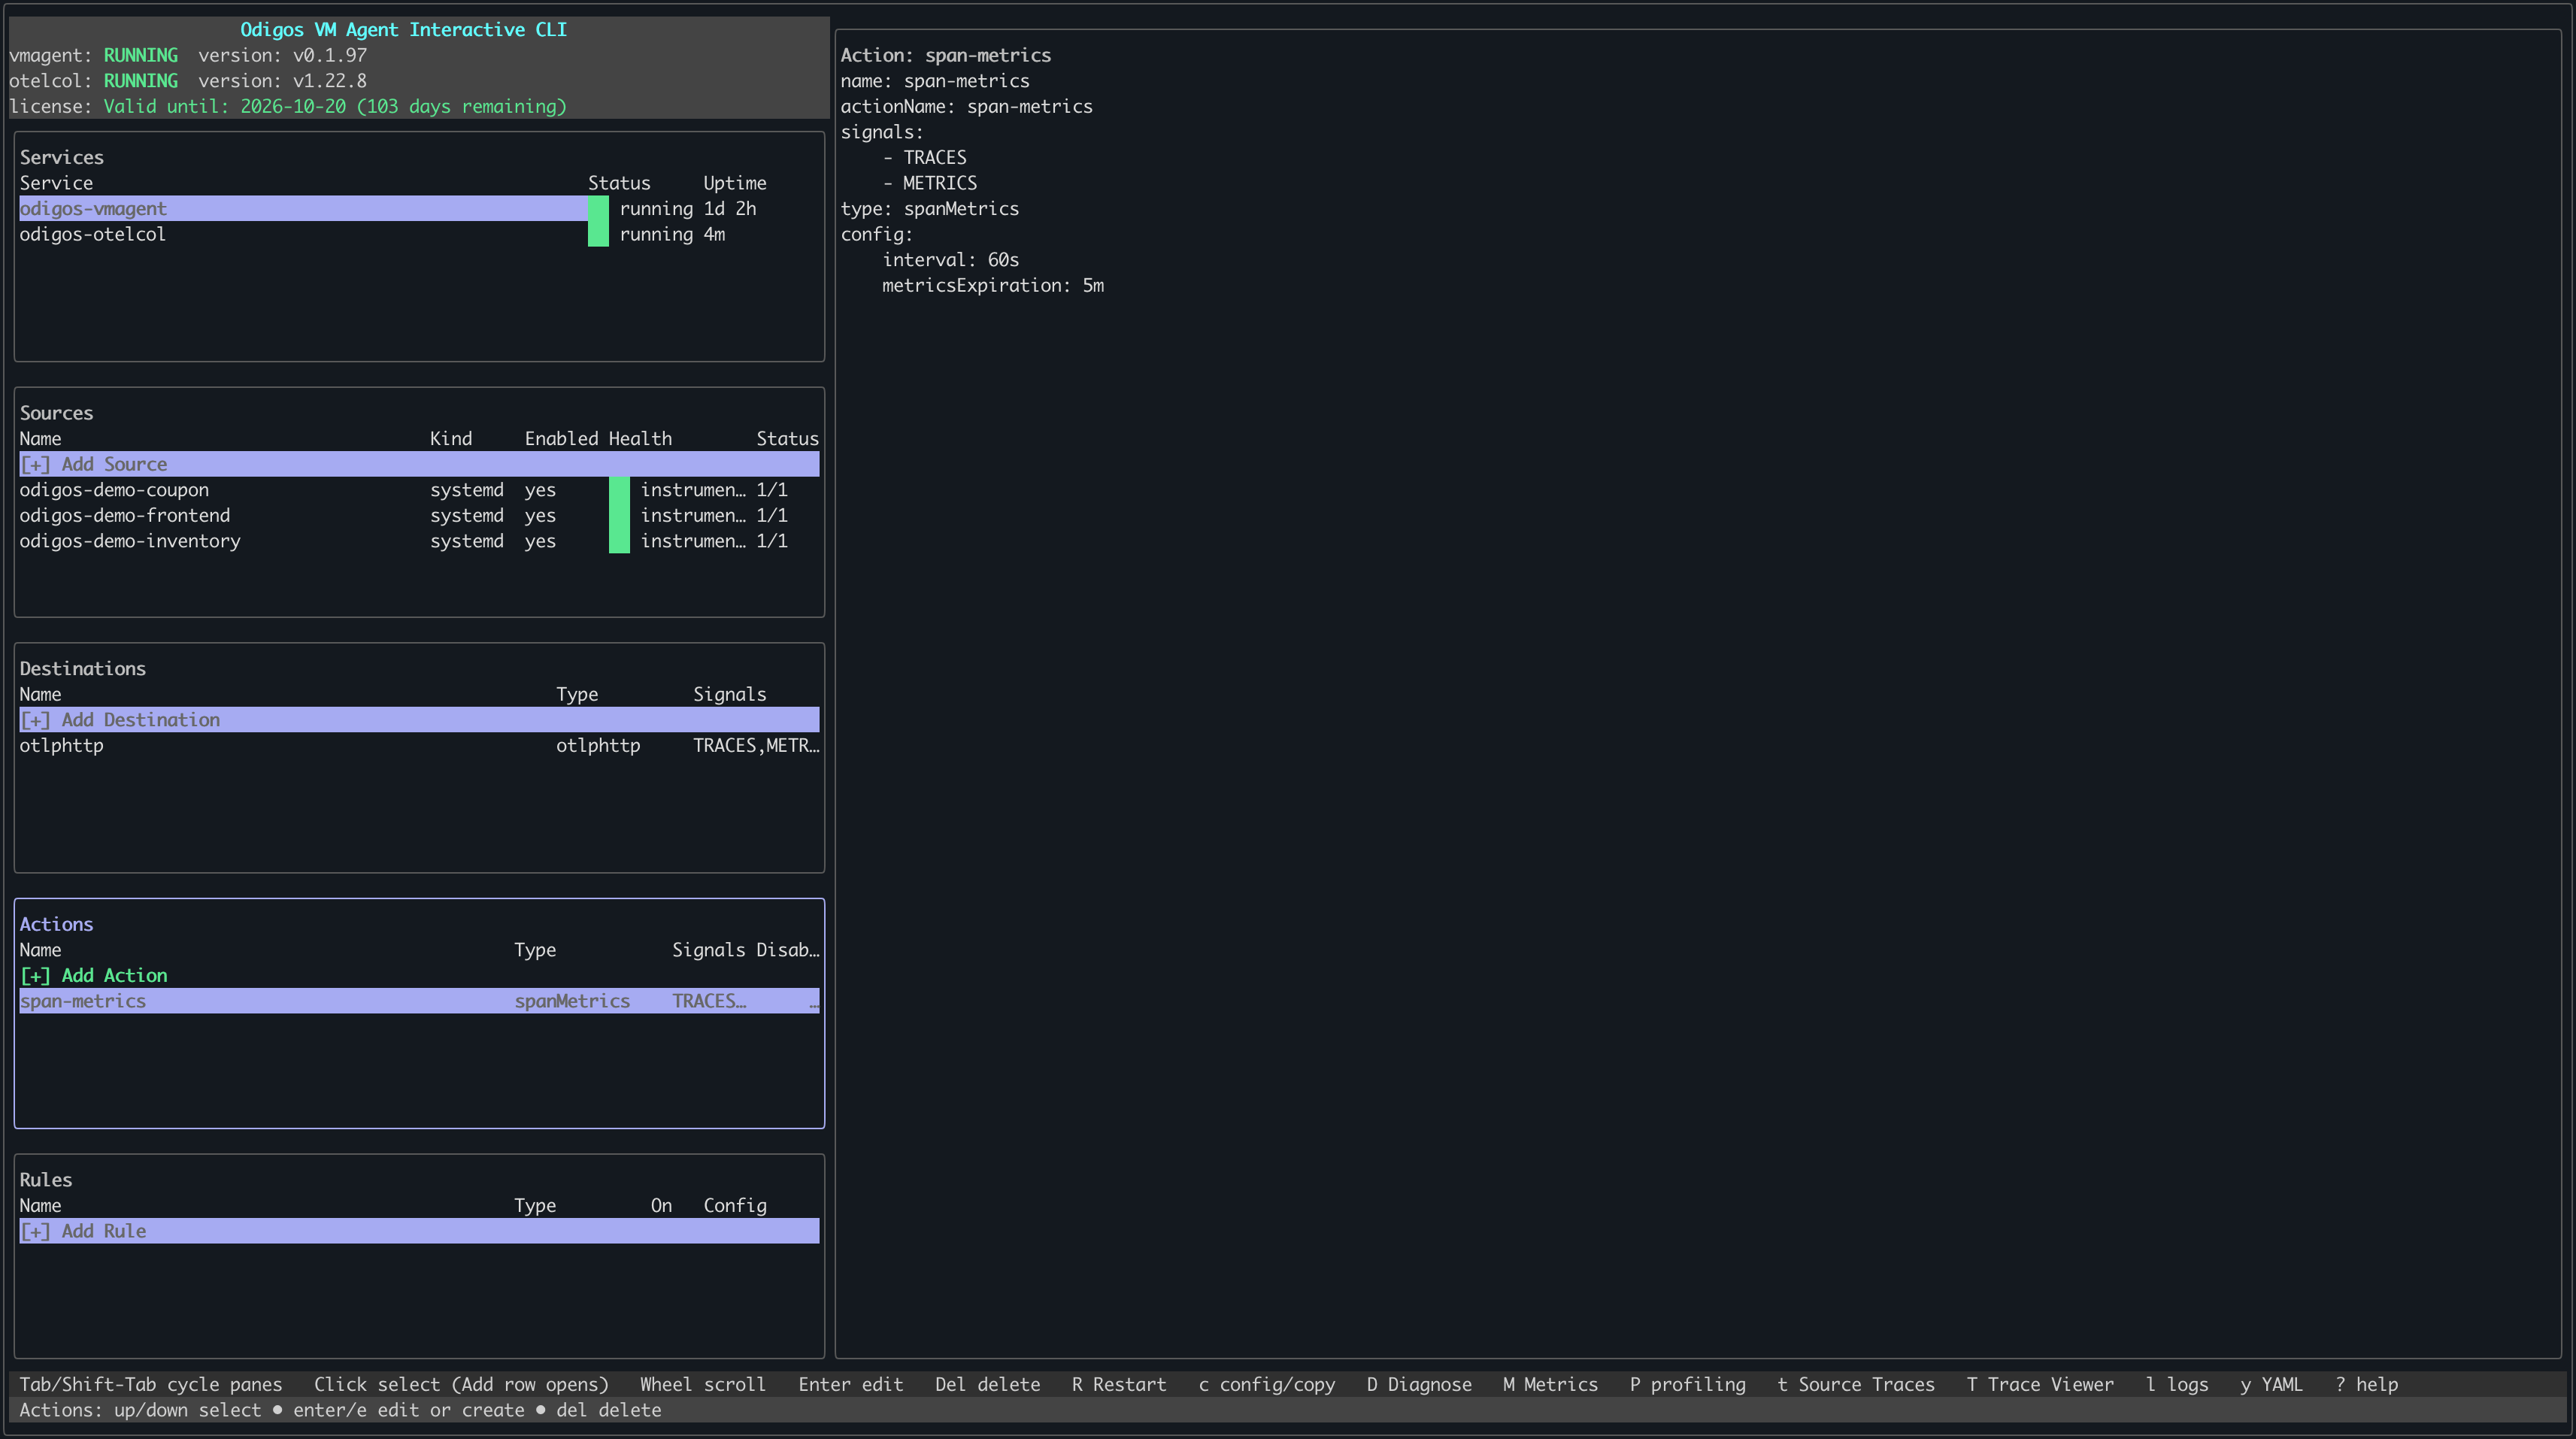
Verify the action has been created