This guide walks you through enabling the eBPF profiling pipeline on a host, and adding a destination that accepts OTLP profiles.
Step 1: Enable the profiling pipeline
Turn on the eBPF profiles pipeline on odigos-otelcol. You can use odictl or edit /etc/odigos-vmagent/config.yaml directly.
Open the Configuration Editor
Press c to open the Configuration Editor, then navigate to Profiling. Set profiling.enabled to true
Set profiling.enabled to true and press Ctrl+S to save. The collector reloads automatically.
Add to /etc/odigos-vmagent/config.yaml: Step 2: Enable sources for the workloads you want to profile
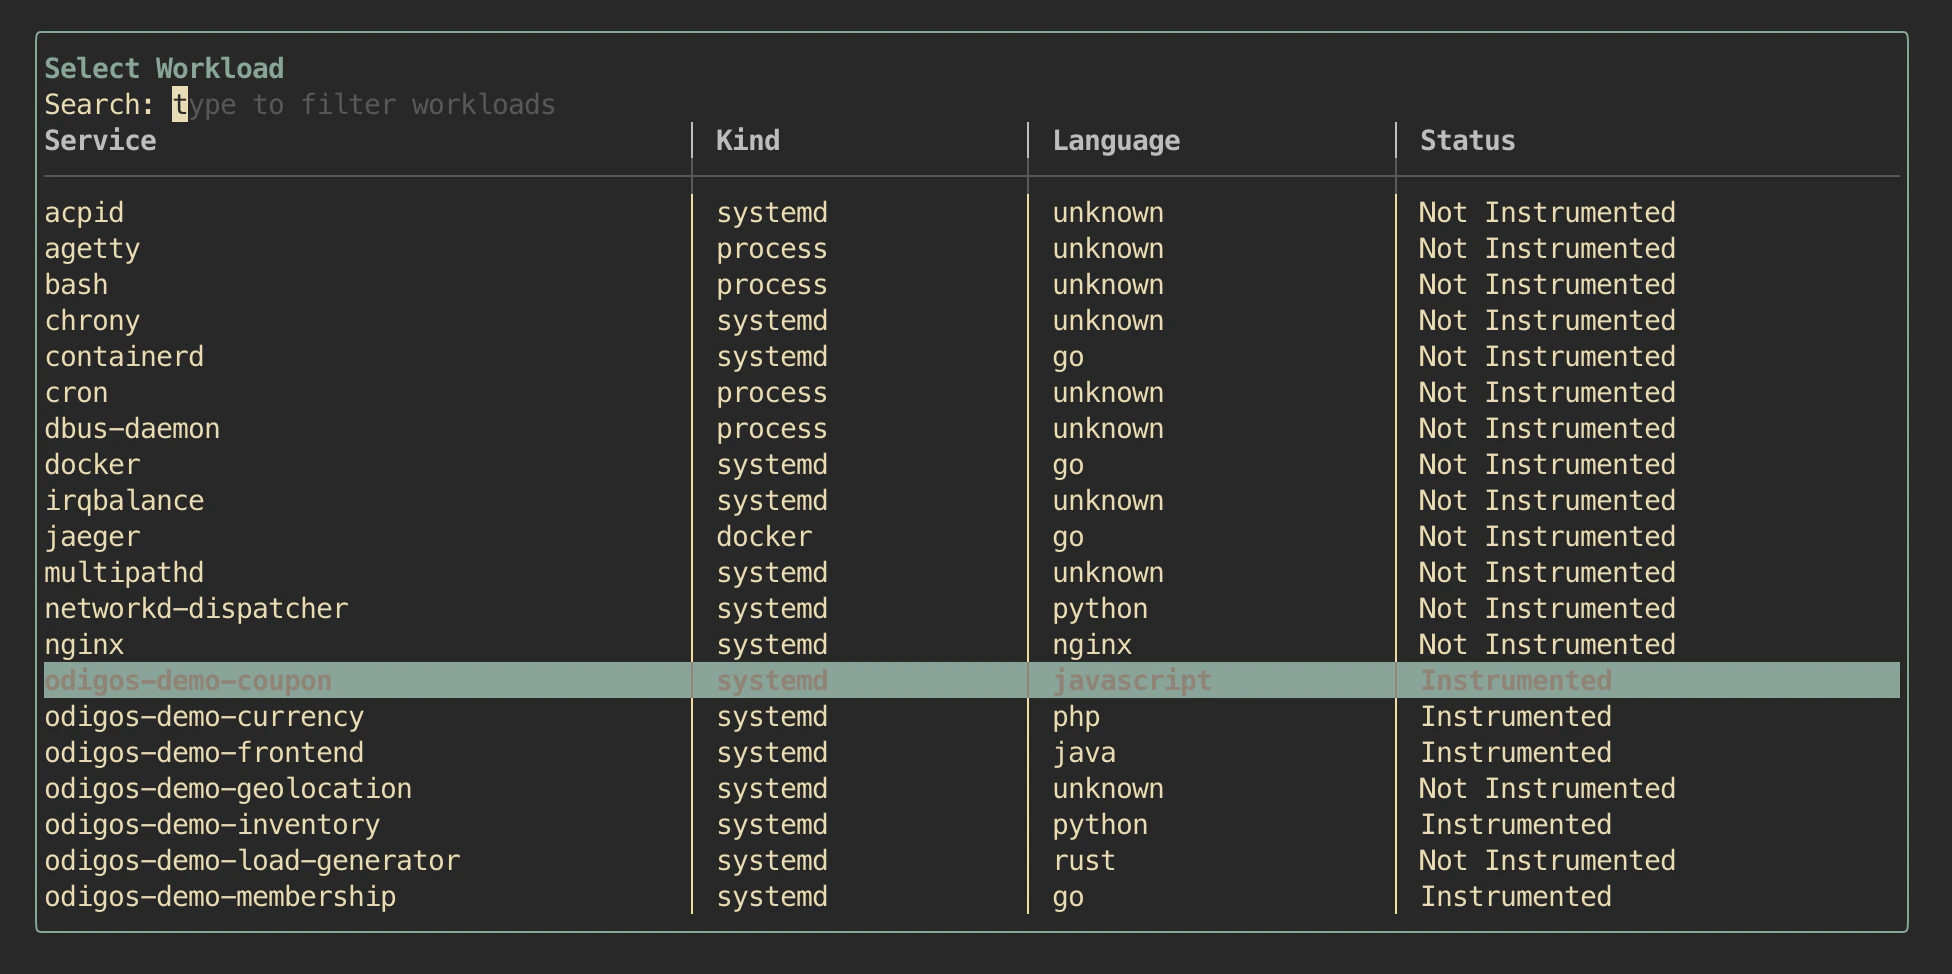
Profiling only retains samples for enabled sources. Open odictl, focus the Sources pane (press o), and instrument the services you want sampled. The screenshot below shows the demo workloads enabled (Instrumented) alongside other host processes that stay untouched (Not Instrumented).
 See Sources for the full walkthrough (TUI and YAML).
Toggling a source on or off takes effect within seconds — no vm-agent restart is needed. The collector keeps streaming profiles, but only samples for currently-enabled PIDs are exported.
Step 3: Add a destination that accepts PROFILES
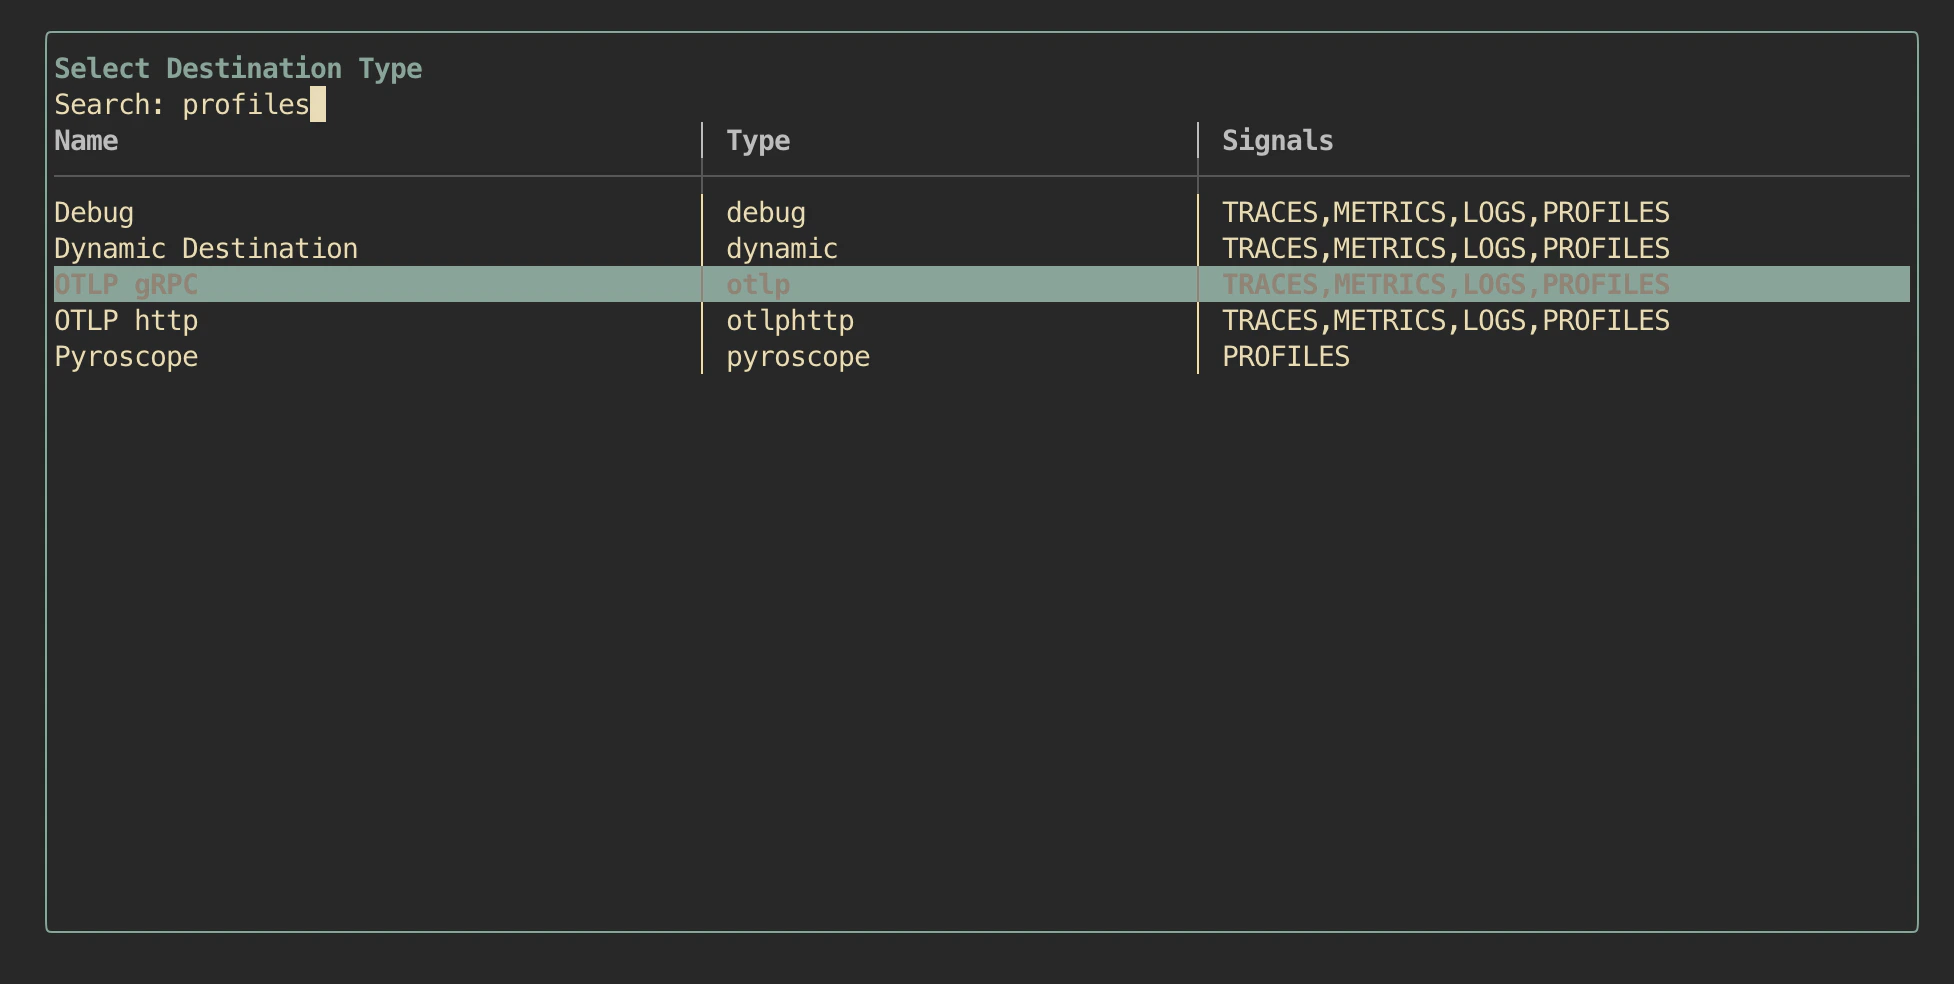
Open Destinations → + Add Destination and search for profiles. Any destination whose Signals column includes PROFILES or they accept OTLP Profiles signal works.
 As an example for step-by-step Pyroscope configuration, jump to Export to Pyroscope. For any other OTLP Profiles backend (e.g.
 otlp or otlphttp), follow the standard Add destinations.
Step 4: View profiles in the destination
Open your destination’s UI and you should be able to access the application profiles collected.
eg in Pyroscope, select profile type process_cpu and filter by service.name values that match your sources. See Export to Pyroscope → View profiles for detailed example.
Getting Help
If you have any issues, or require our assistance, please open an issue in GitHub, or reach out to us in Odigos Slack