odictl includes a built-in profiling view so you can inspect continuous CPU profiles directly in the terminal—without opening an external backend. Use it to find the functions consuming the most CPU in a service, and to drive profile-driven custom instrumentation.
Prerequisites
- VM Agent installed and running (Installation).
- At least one source enabled for the workloads you want to profile.
- The profiling pipeline enabled. You can enable it ahead of time (see Getting started or the Configuration Editor’s Profiling section in odictl), or directly from the profiling view as described below.
Open the profiling view
From the mainodictl dashboard, press Shift+P to open the profiling view.
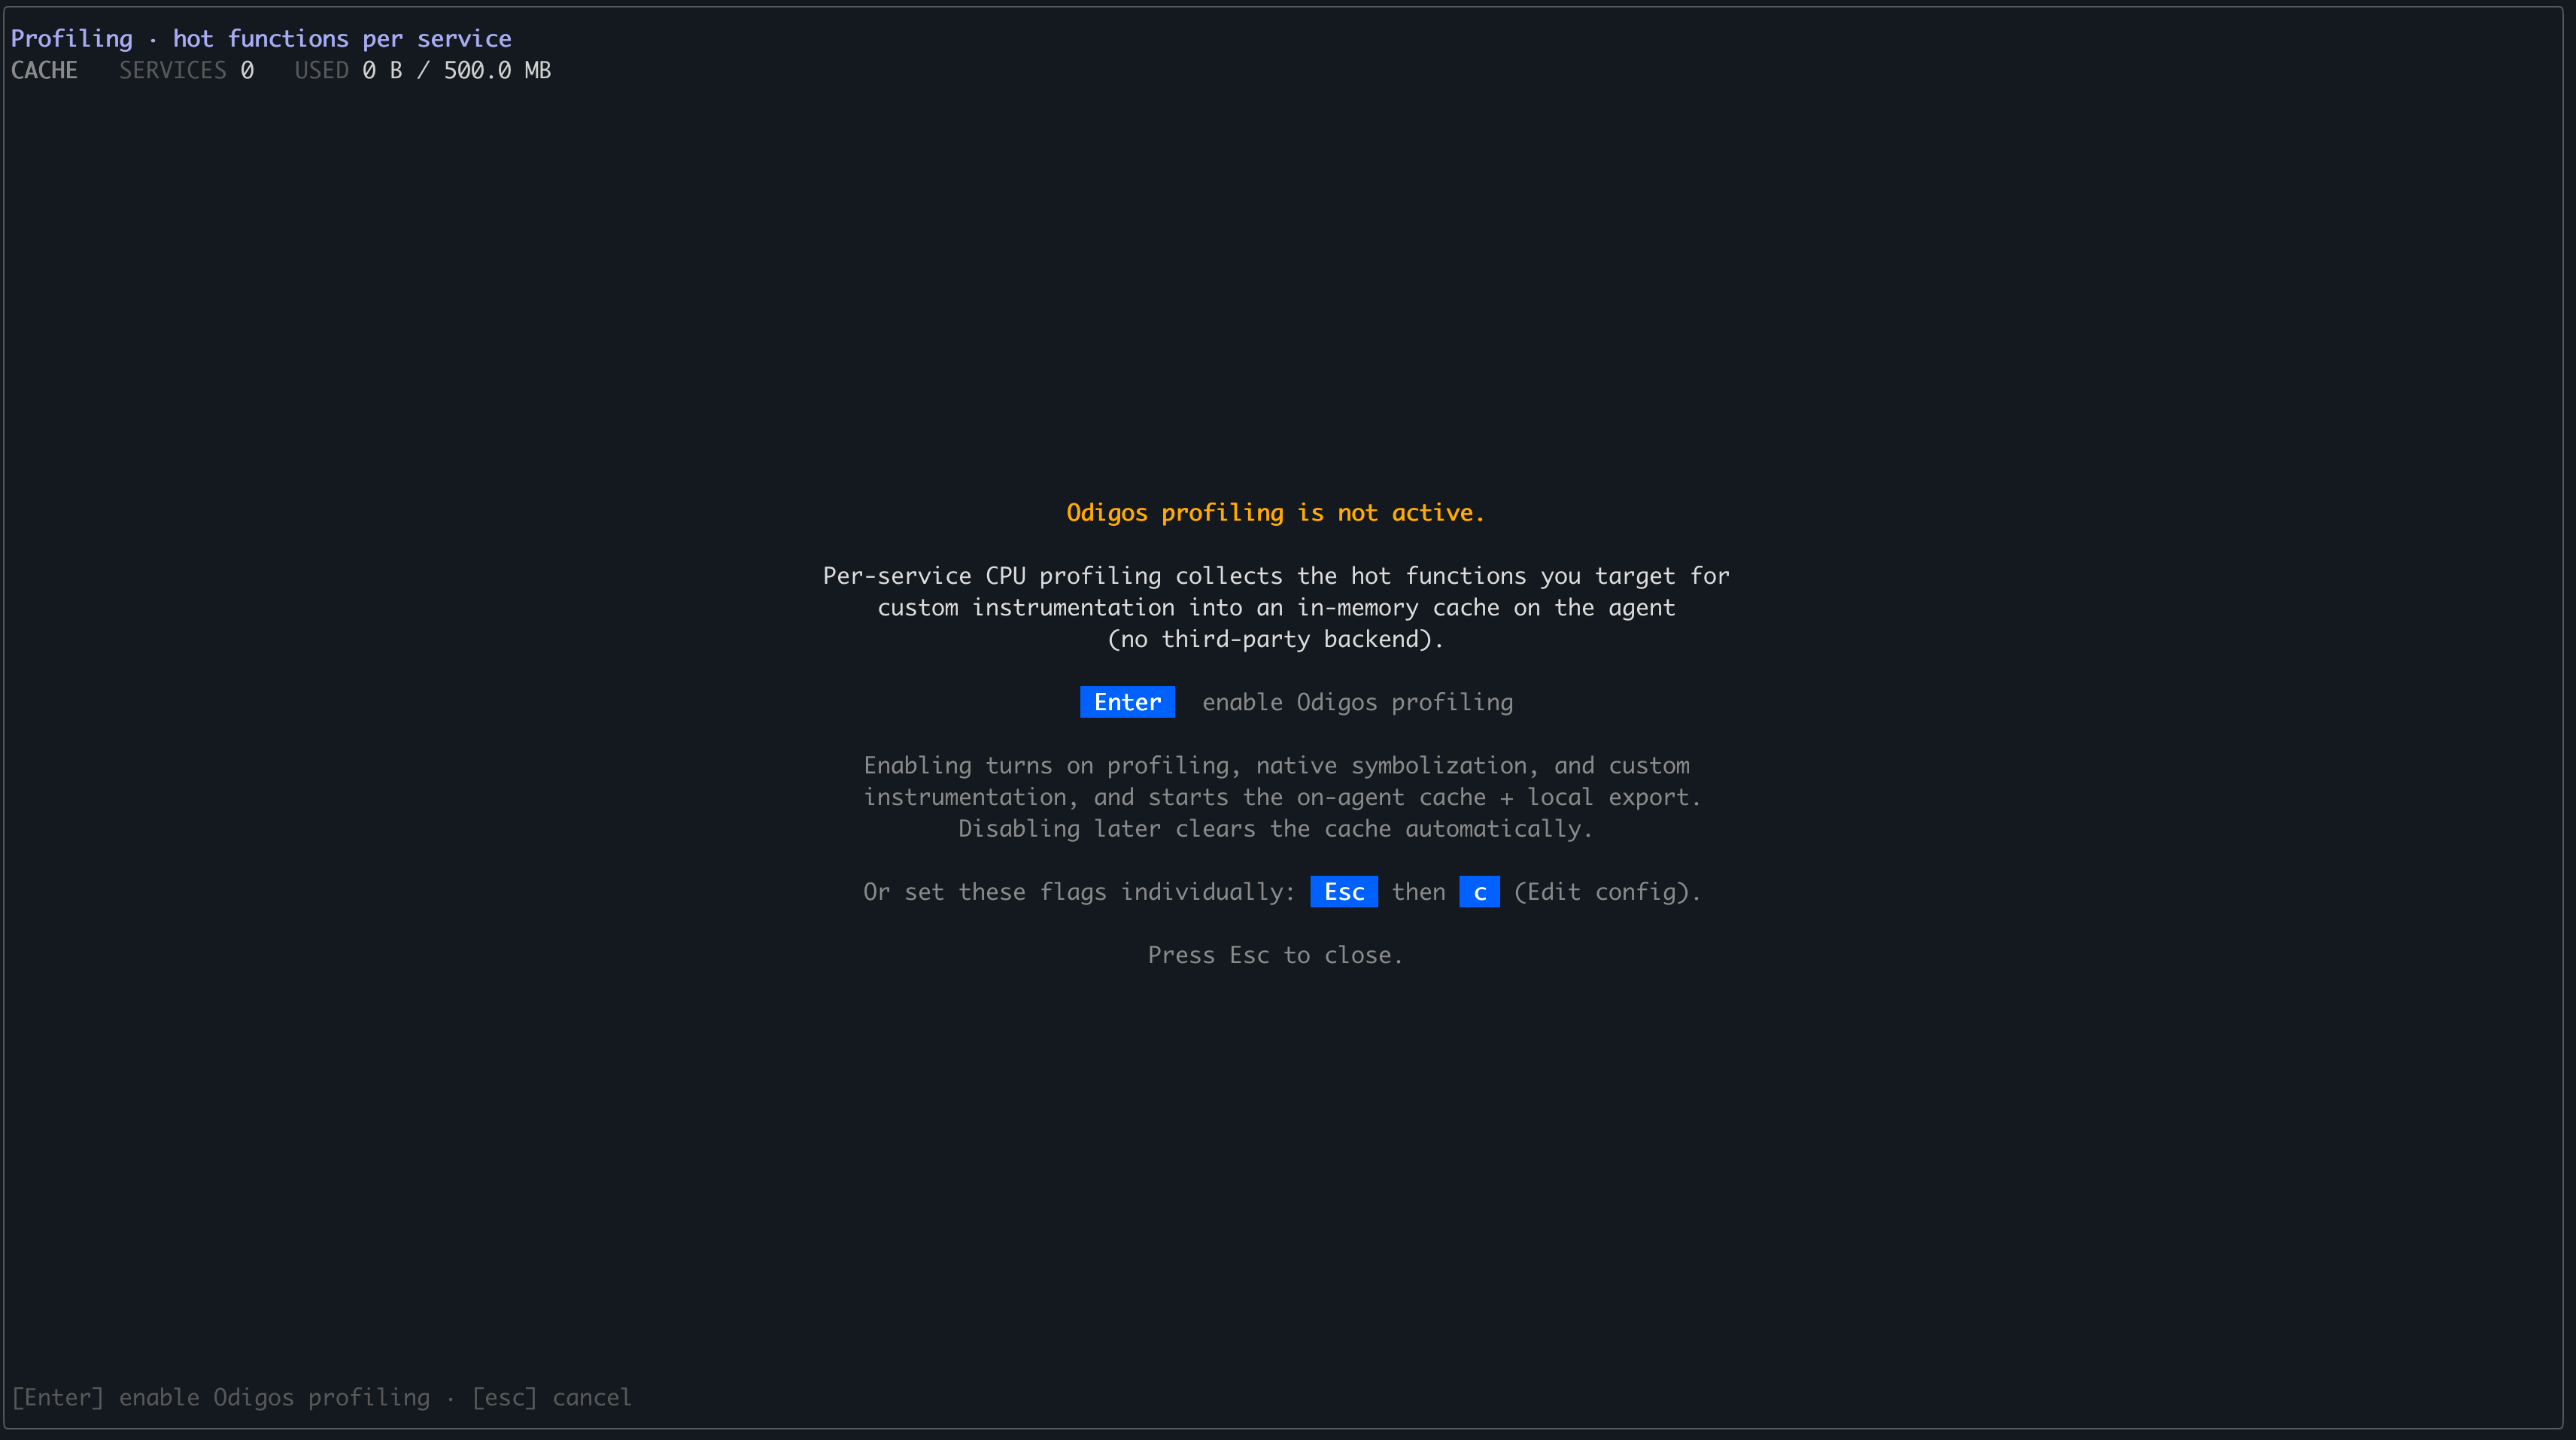
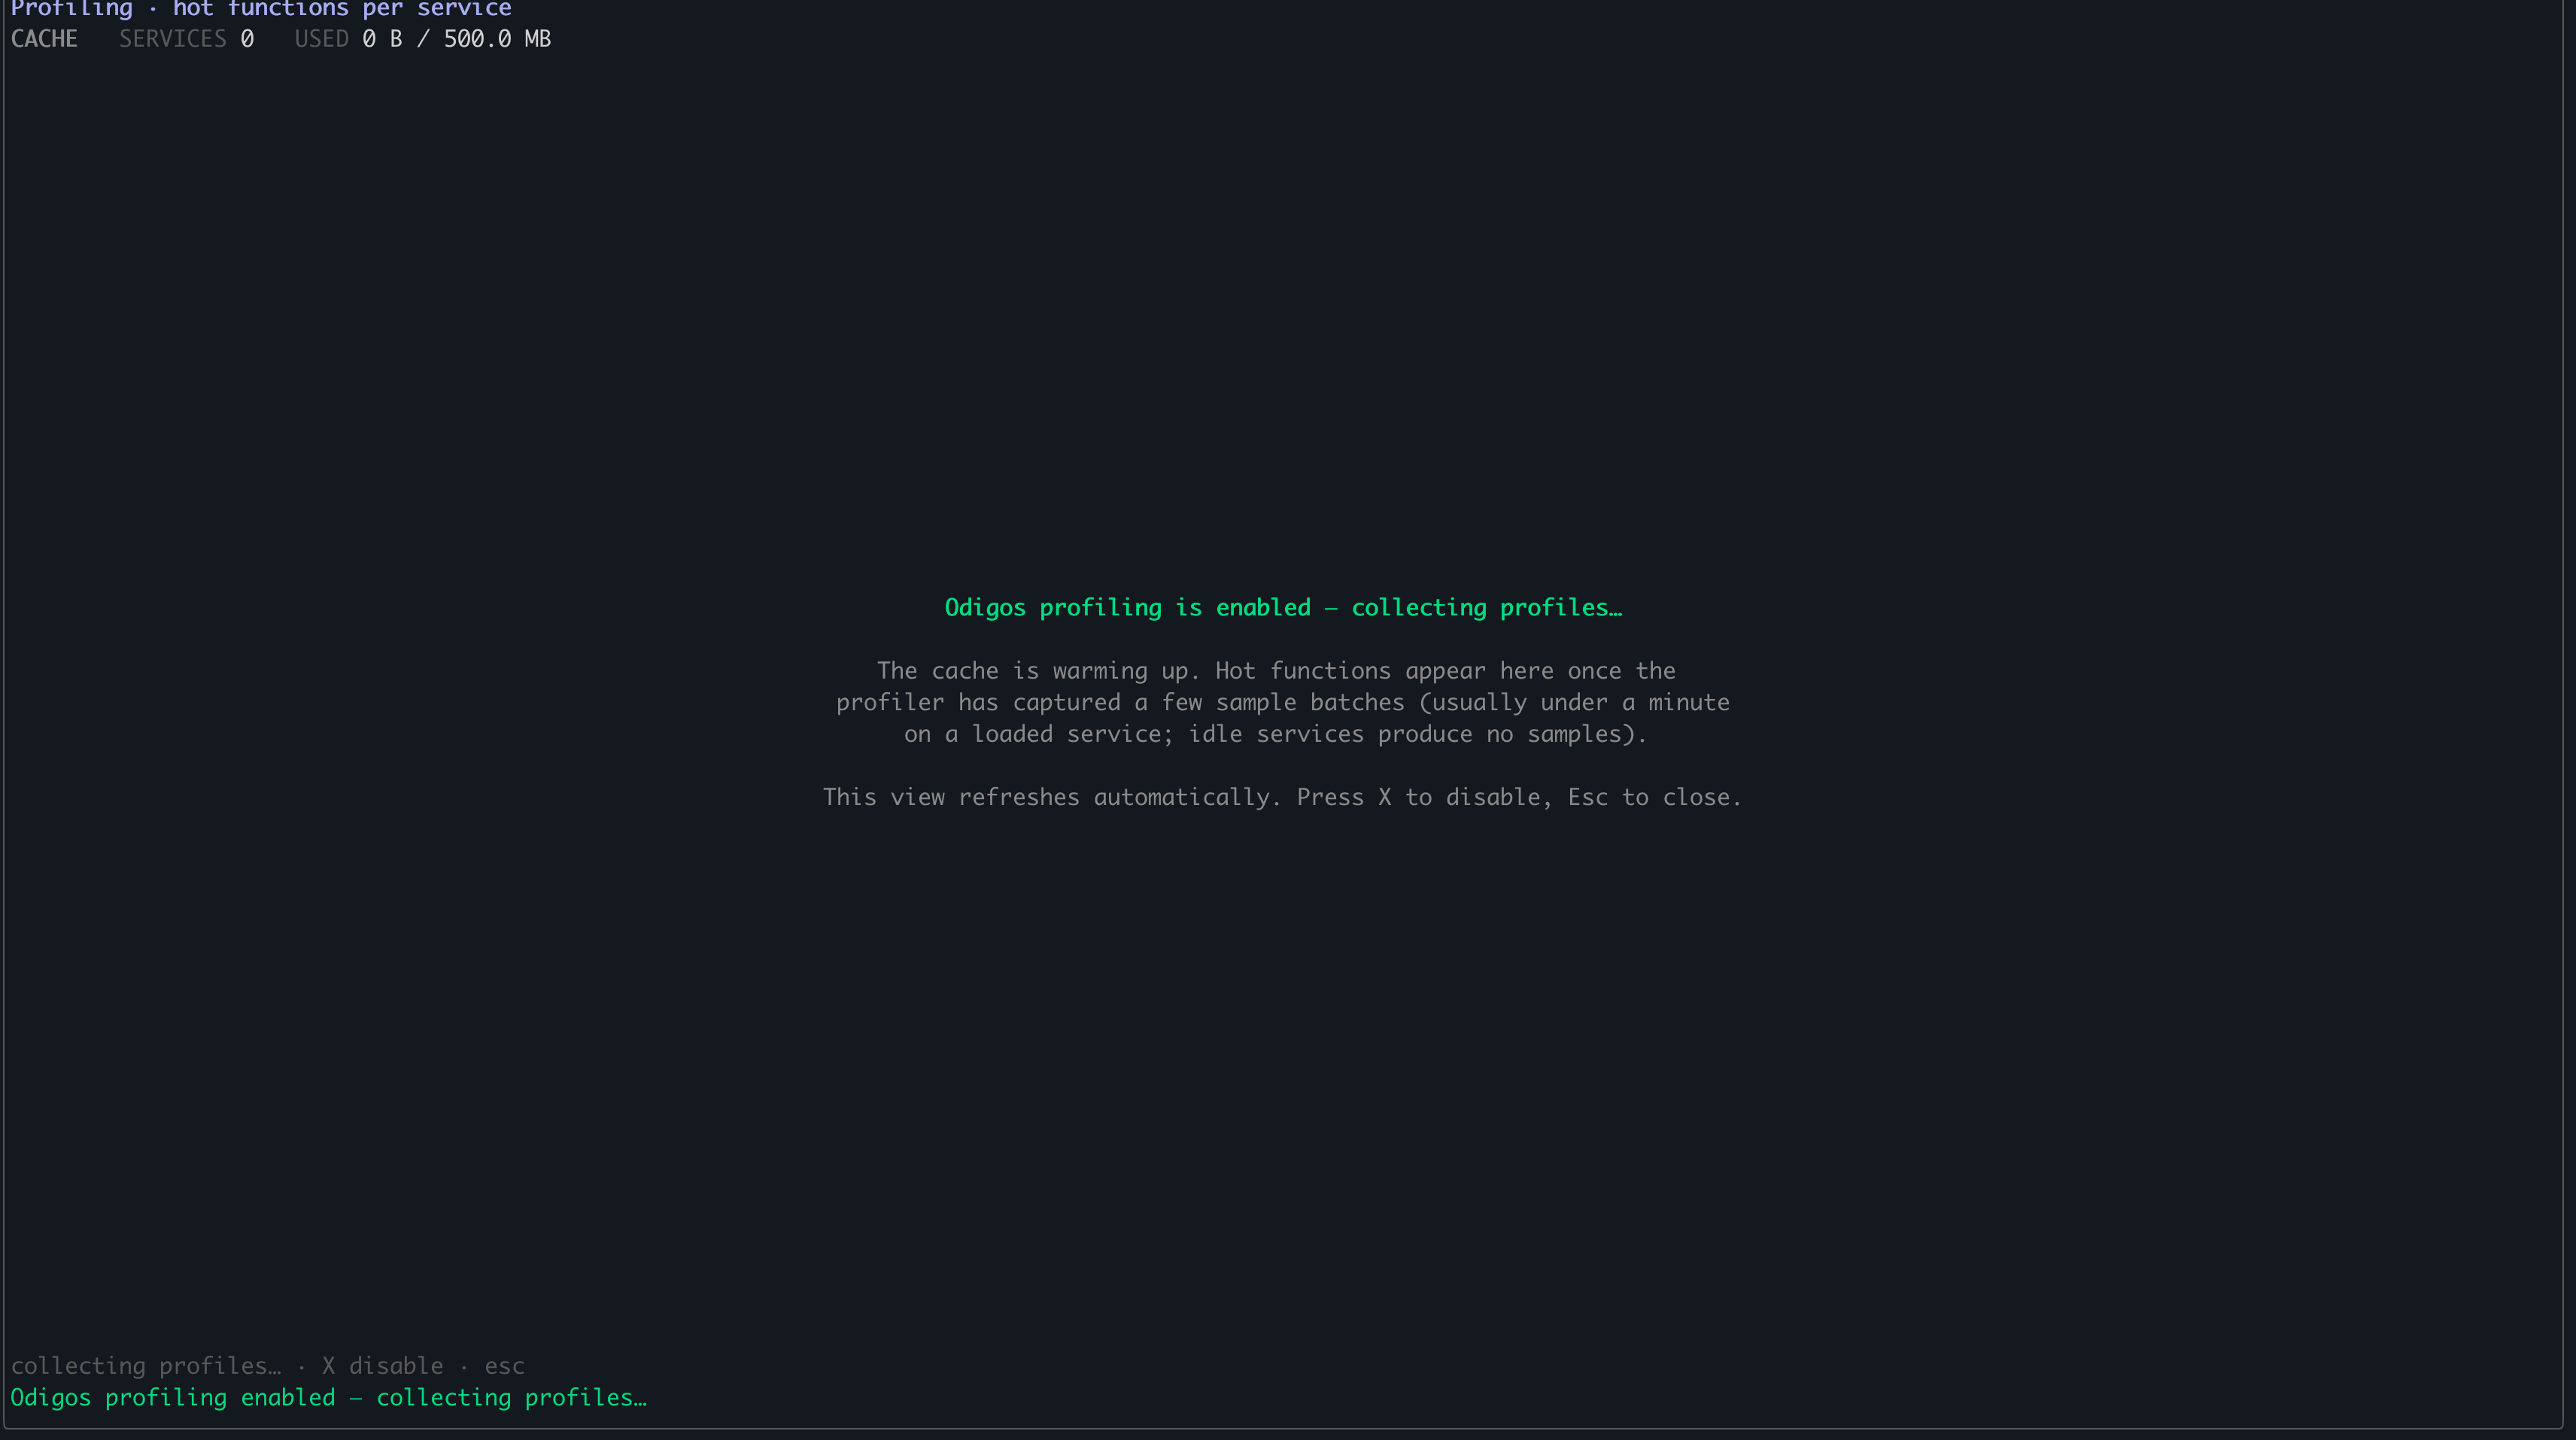
If profiling is not yet enabled, odictl shows an Odigos profiling is not enabled prompt. Press Enter to enable it.
You can also enable profiling without opening this view by setting profiling.enabled in the Configuration Editor. See Getting started for the full setup.
Navigating the profiling view
The profiling view has three panes: a Services list on the left, a Filter modules bar across the top, and a Functions list. UseTab to move between them and the arrow keys to move within the focused pane.
| Key | Action |
|---|---|
Shift+P | Open the profiling view from the dashboard |
Tab | Cycle between the Services, Filter modules, and Functions panes |
↑ / ↓ | Move between items in the focused pane |
Space | Toggle the highlighted module in the Filter modules pane |
a | Show app-only functions |
i | Instrument the highlighted function (or remove its instrumentation) |
Esc | Return to the main dashboard |
Mouse selection is not supported in the profiling view. Use the arrow keys to select items and
Tab to switch panes.Services pane
The left pane lists the services that have profile data. Use the arrow keys to highlight the service you want to inspect.Filter modules
PressTab to focus the Filter modules bar at the top. It controls which modules and sample types appear in the Functions list:
- Module — selects which modules to show in the profile. This is set based on the language of the selected service (for example, Java). You can also choose
vmlinuxor other libraries based on the runtime/language. PressSpaceto toggle the highlighted module. - Type — defaults to
app. You can also selectlibraryorkernel, or pressato show app-only functions.
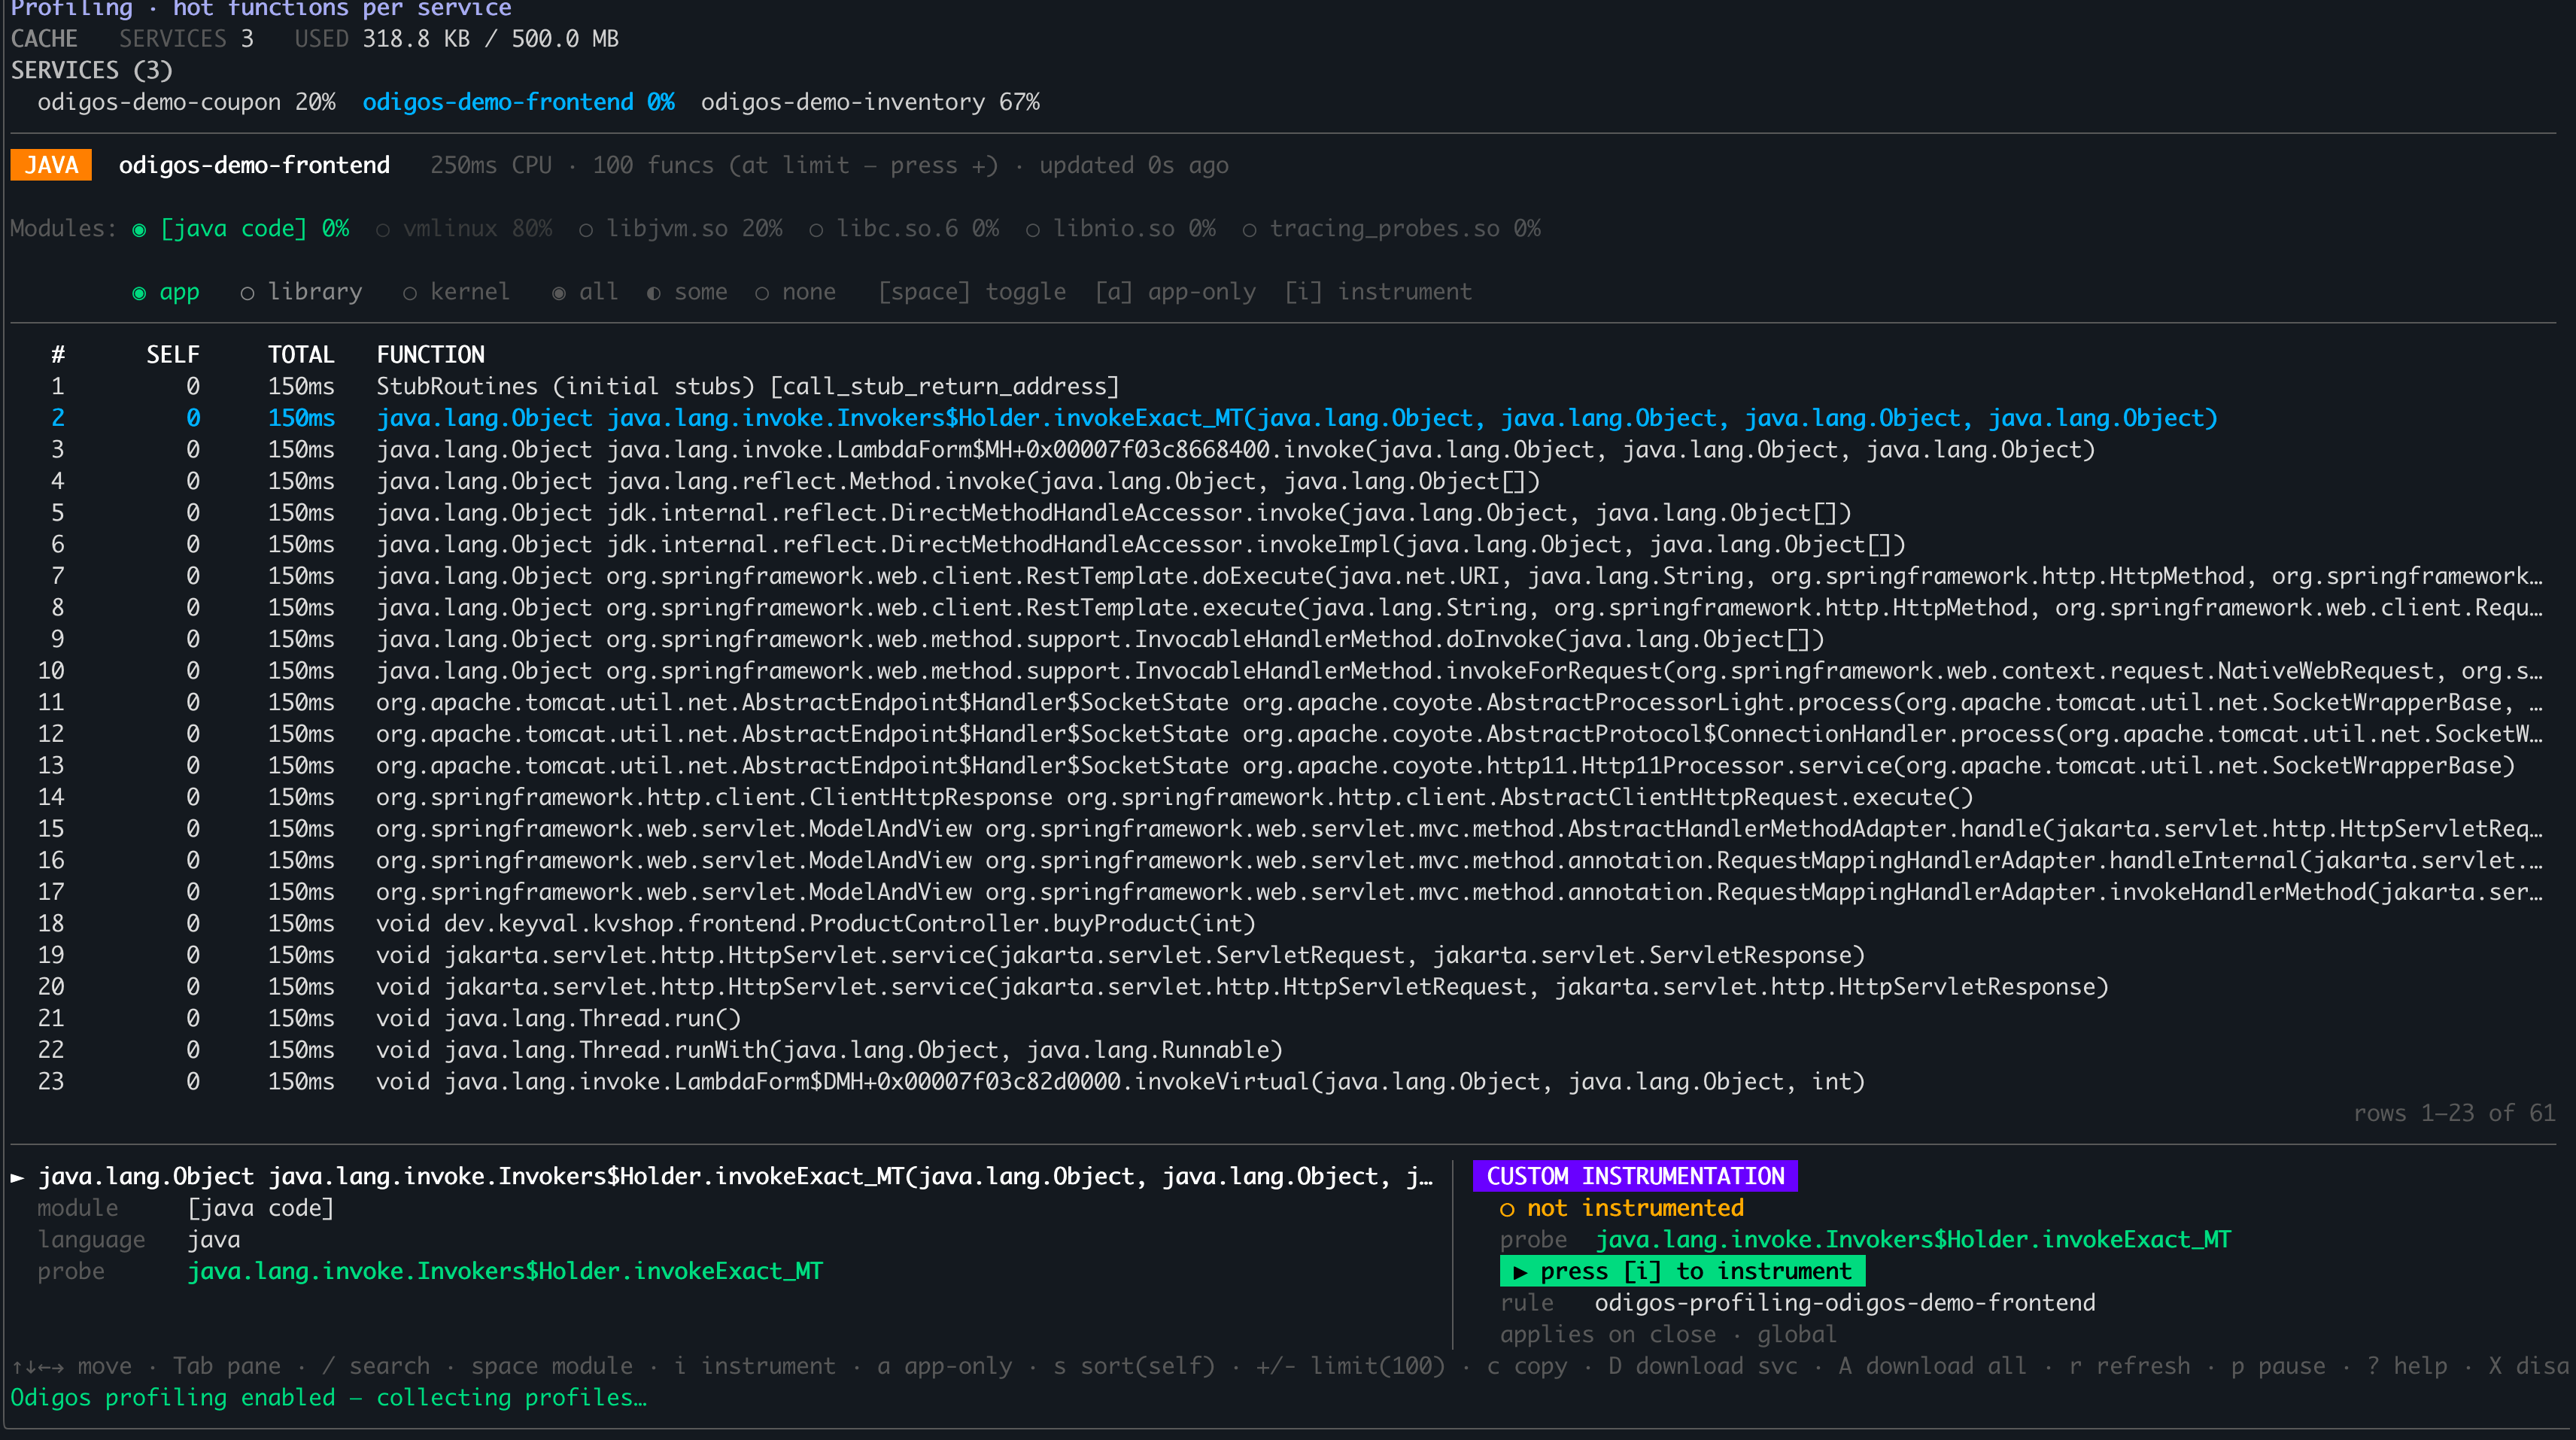
Functions pane
PressTab again to focus the list of profiled functions for the selected service and filter. Use the arrow keys to highlight a function. From here, press i to instrument the highlighted function (the panel then shows [i] remove to undo it)—see Instrument from Profiles for the full workflow.