

See it in action!
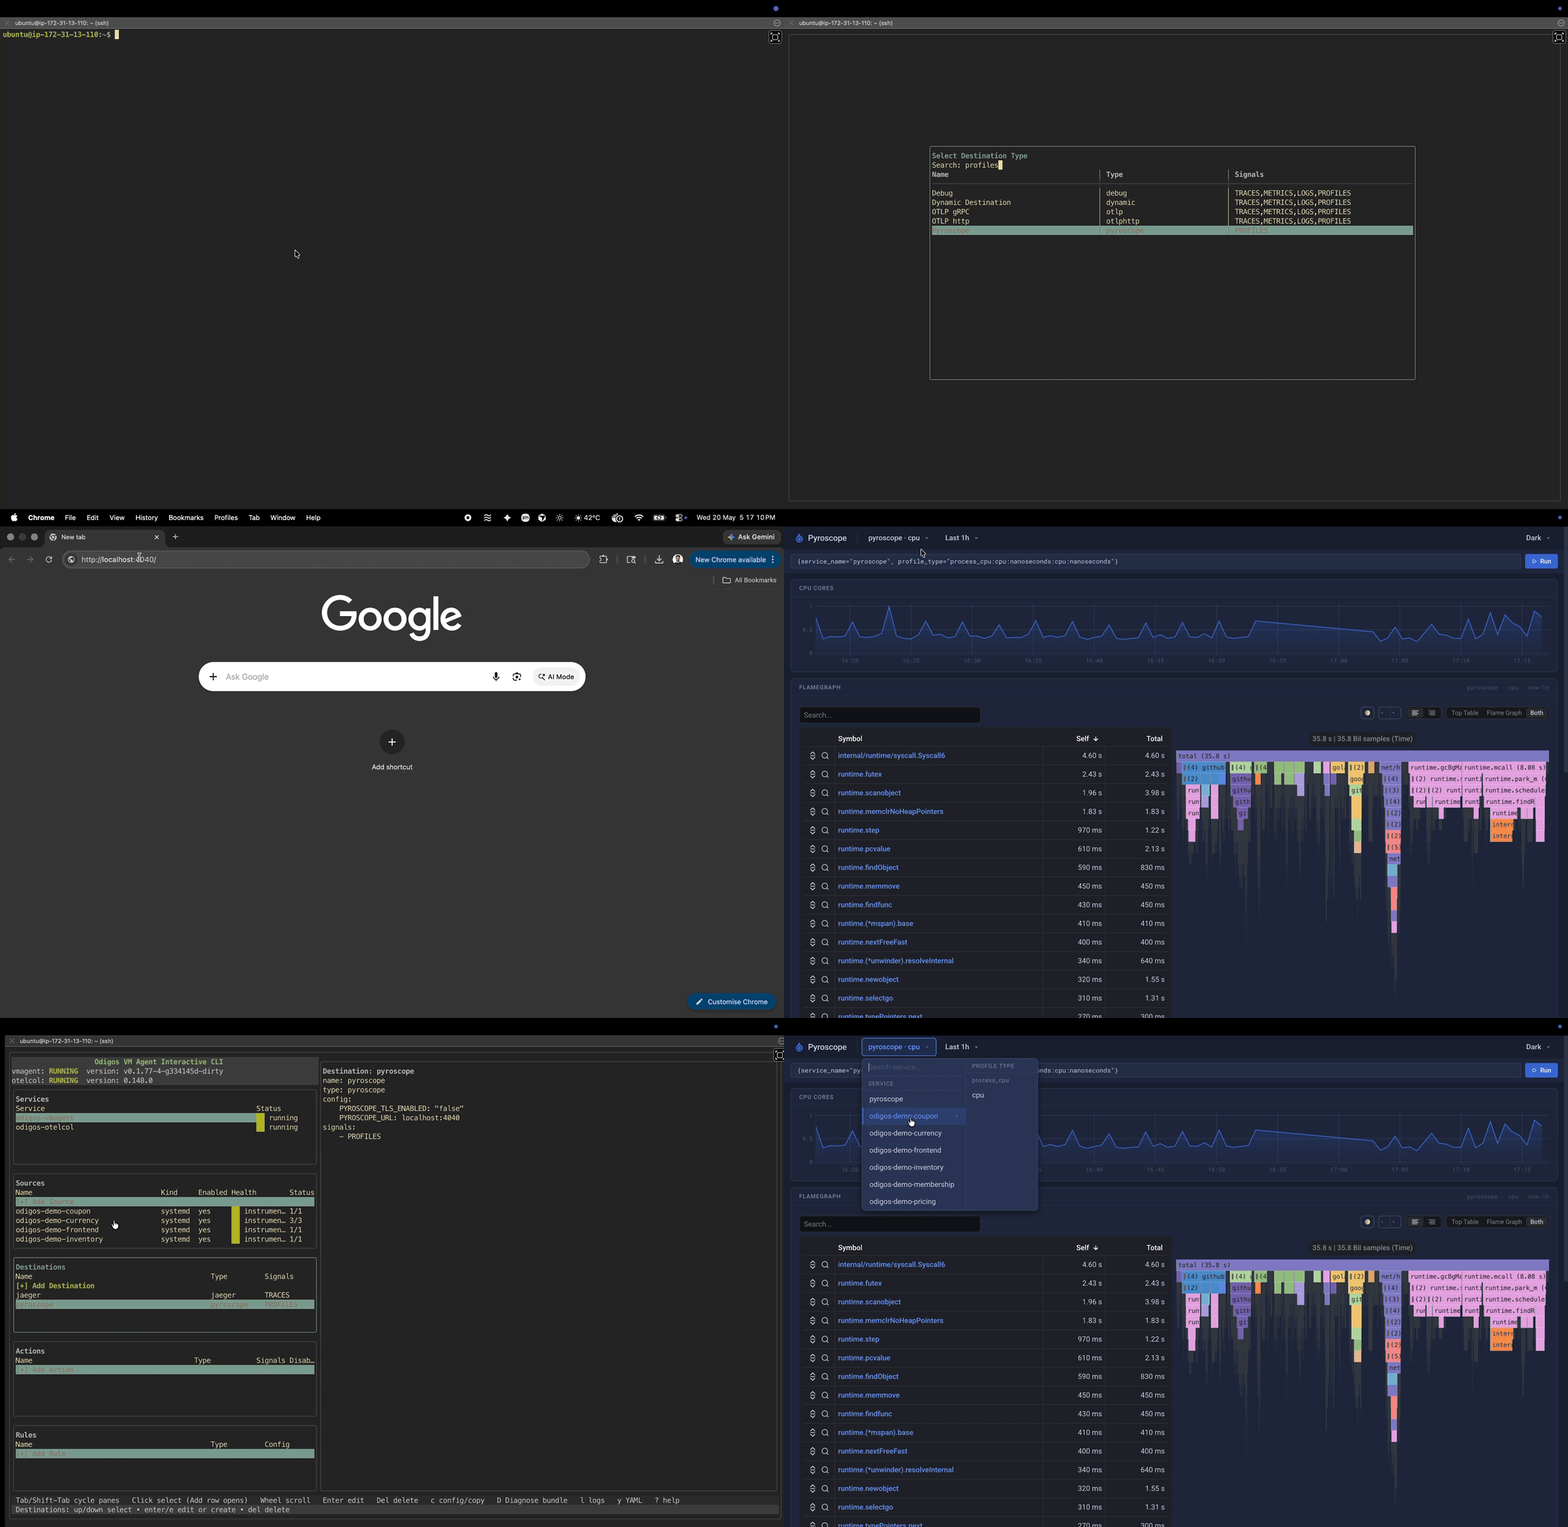
The clip below shows the full path on a host: enablingprofiling.enabled via odictl, adding a Pyroscope destination, and the resulting flame graph in the Pyroscope UI.
What is continuous CPU profiling?
CPU profiling samples what your processes are doing on the CPU. Over time, those samples form a flame graph that shows which functions and libraries consume the most CPU time. Unlike traces, which tell you that a request was slow, profiles show where CPU time was spent. Use profiles after traces (or metrics) point you at a hot service.How it works on the VM Agent
- You enable the profiling pipeline in agent config (
profiling.enabled: true). - odigos-otelcol runs the OpenTelemetry eBPF profiler receiver on the host.
- Profiles are exported as using OTLP Profiles protocol to a destination which supports OTLP profiles.
Prerequisites
- Linux host meeting VM Agent system requirements (eBPF-capable kernel).
- VM Agent installed and running (Installation).
- At least one source enabled for the workloads you want to profile.
- A destination that accepts the PROFILES signal (see Export to Pyroscope for the recommended setup).