i—odictl generates the matching CustomInstrumentation rule for you.
This UI-driven flow supports Java, Go, and C++.
This page covers the profile-driven, UI-only workflow. To define a rule manually (entering class/method or package/function yourself) or with YAML files, see Custom Instrumentation.
Before you start
- Profiling must be enabled and collecting data. See View profiles in odictl.
- A source must be enabled for the service you want to instrument.
Create a rule from a profile
Open the profiling view and select a function
From the main 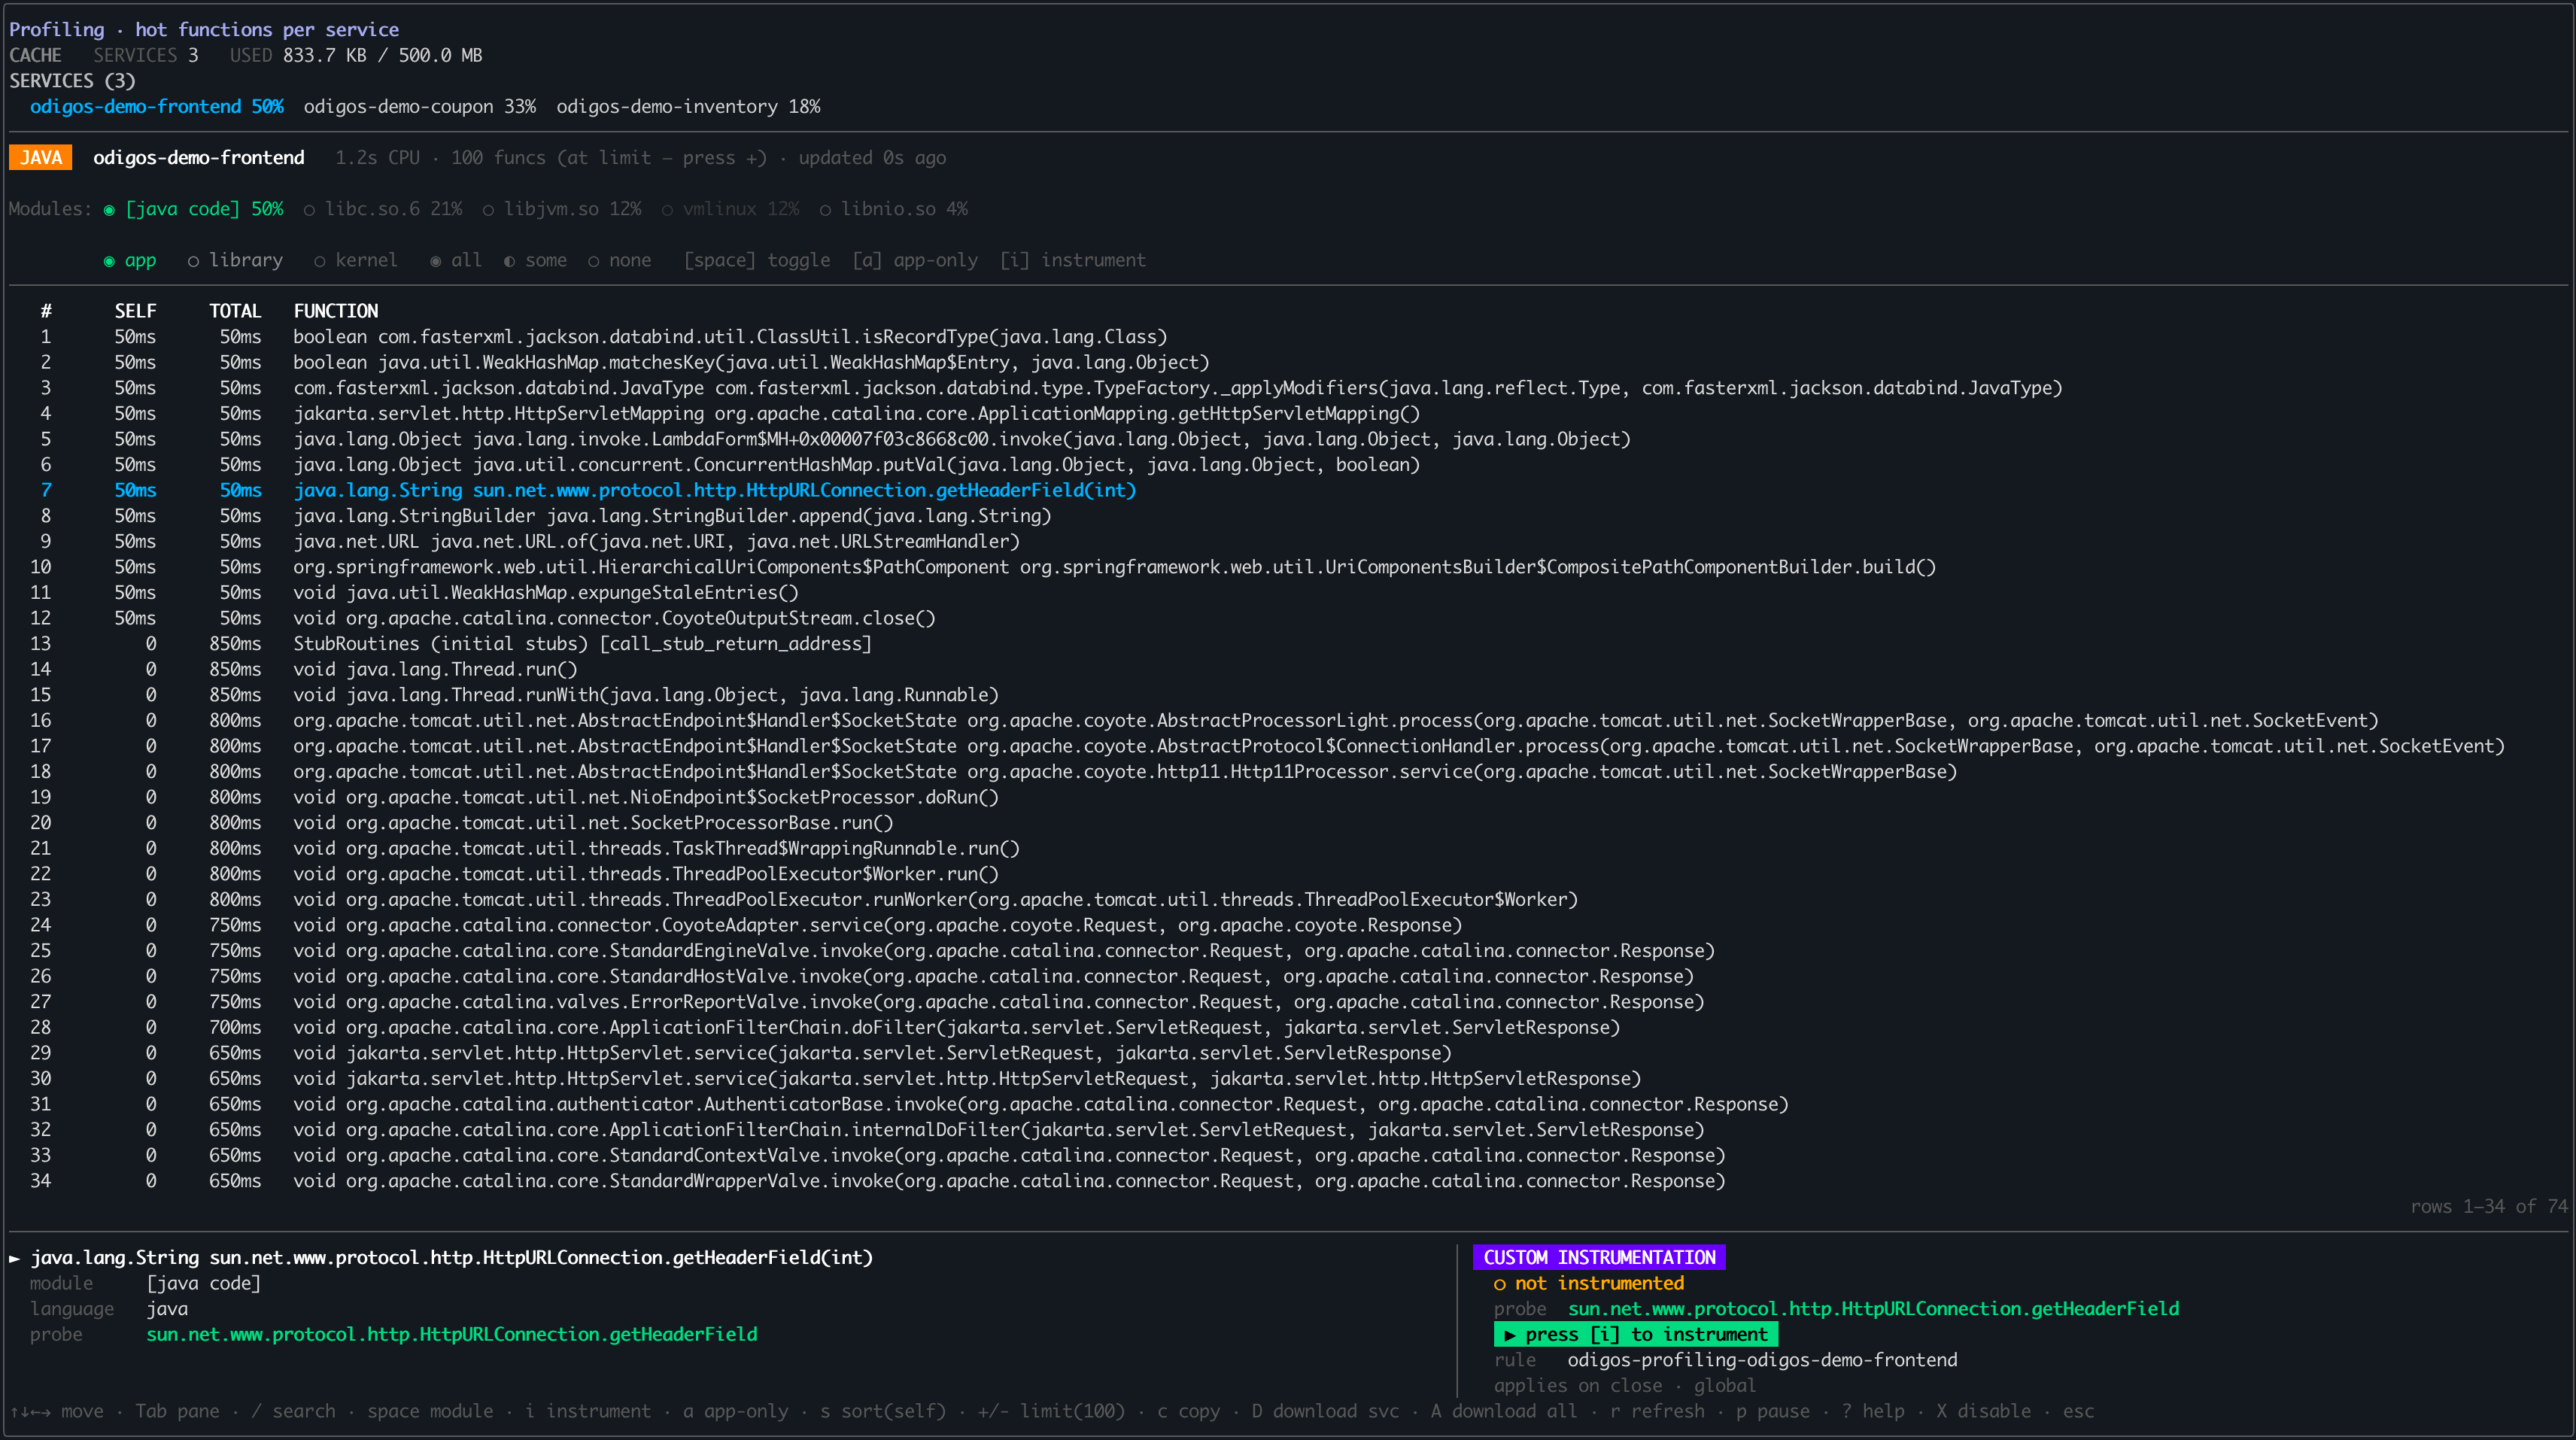
odictl dashboard, press Shift+P to open the profiling view. Use Tab to move between the three panes—Services, Filter modules, and Functions—and the arrow keys to move within the focused pane.- In the Services pane, select a service. Its runtime (Java, Go, or C++) determines the modules shown.
- In the Filter modules pane, adjust the module or type filter if needed.
- In the Functions pane, highlight the function you want to instrument.
odigos-demo-frontend service is selected and the highlighted function is the Java method sun.net.www.protocol.http.HttpURLConnection.getHeaderField.Instrument the function
Press i. The bottom-right panel updates to show the function is Instrumented. In this example, 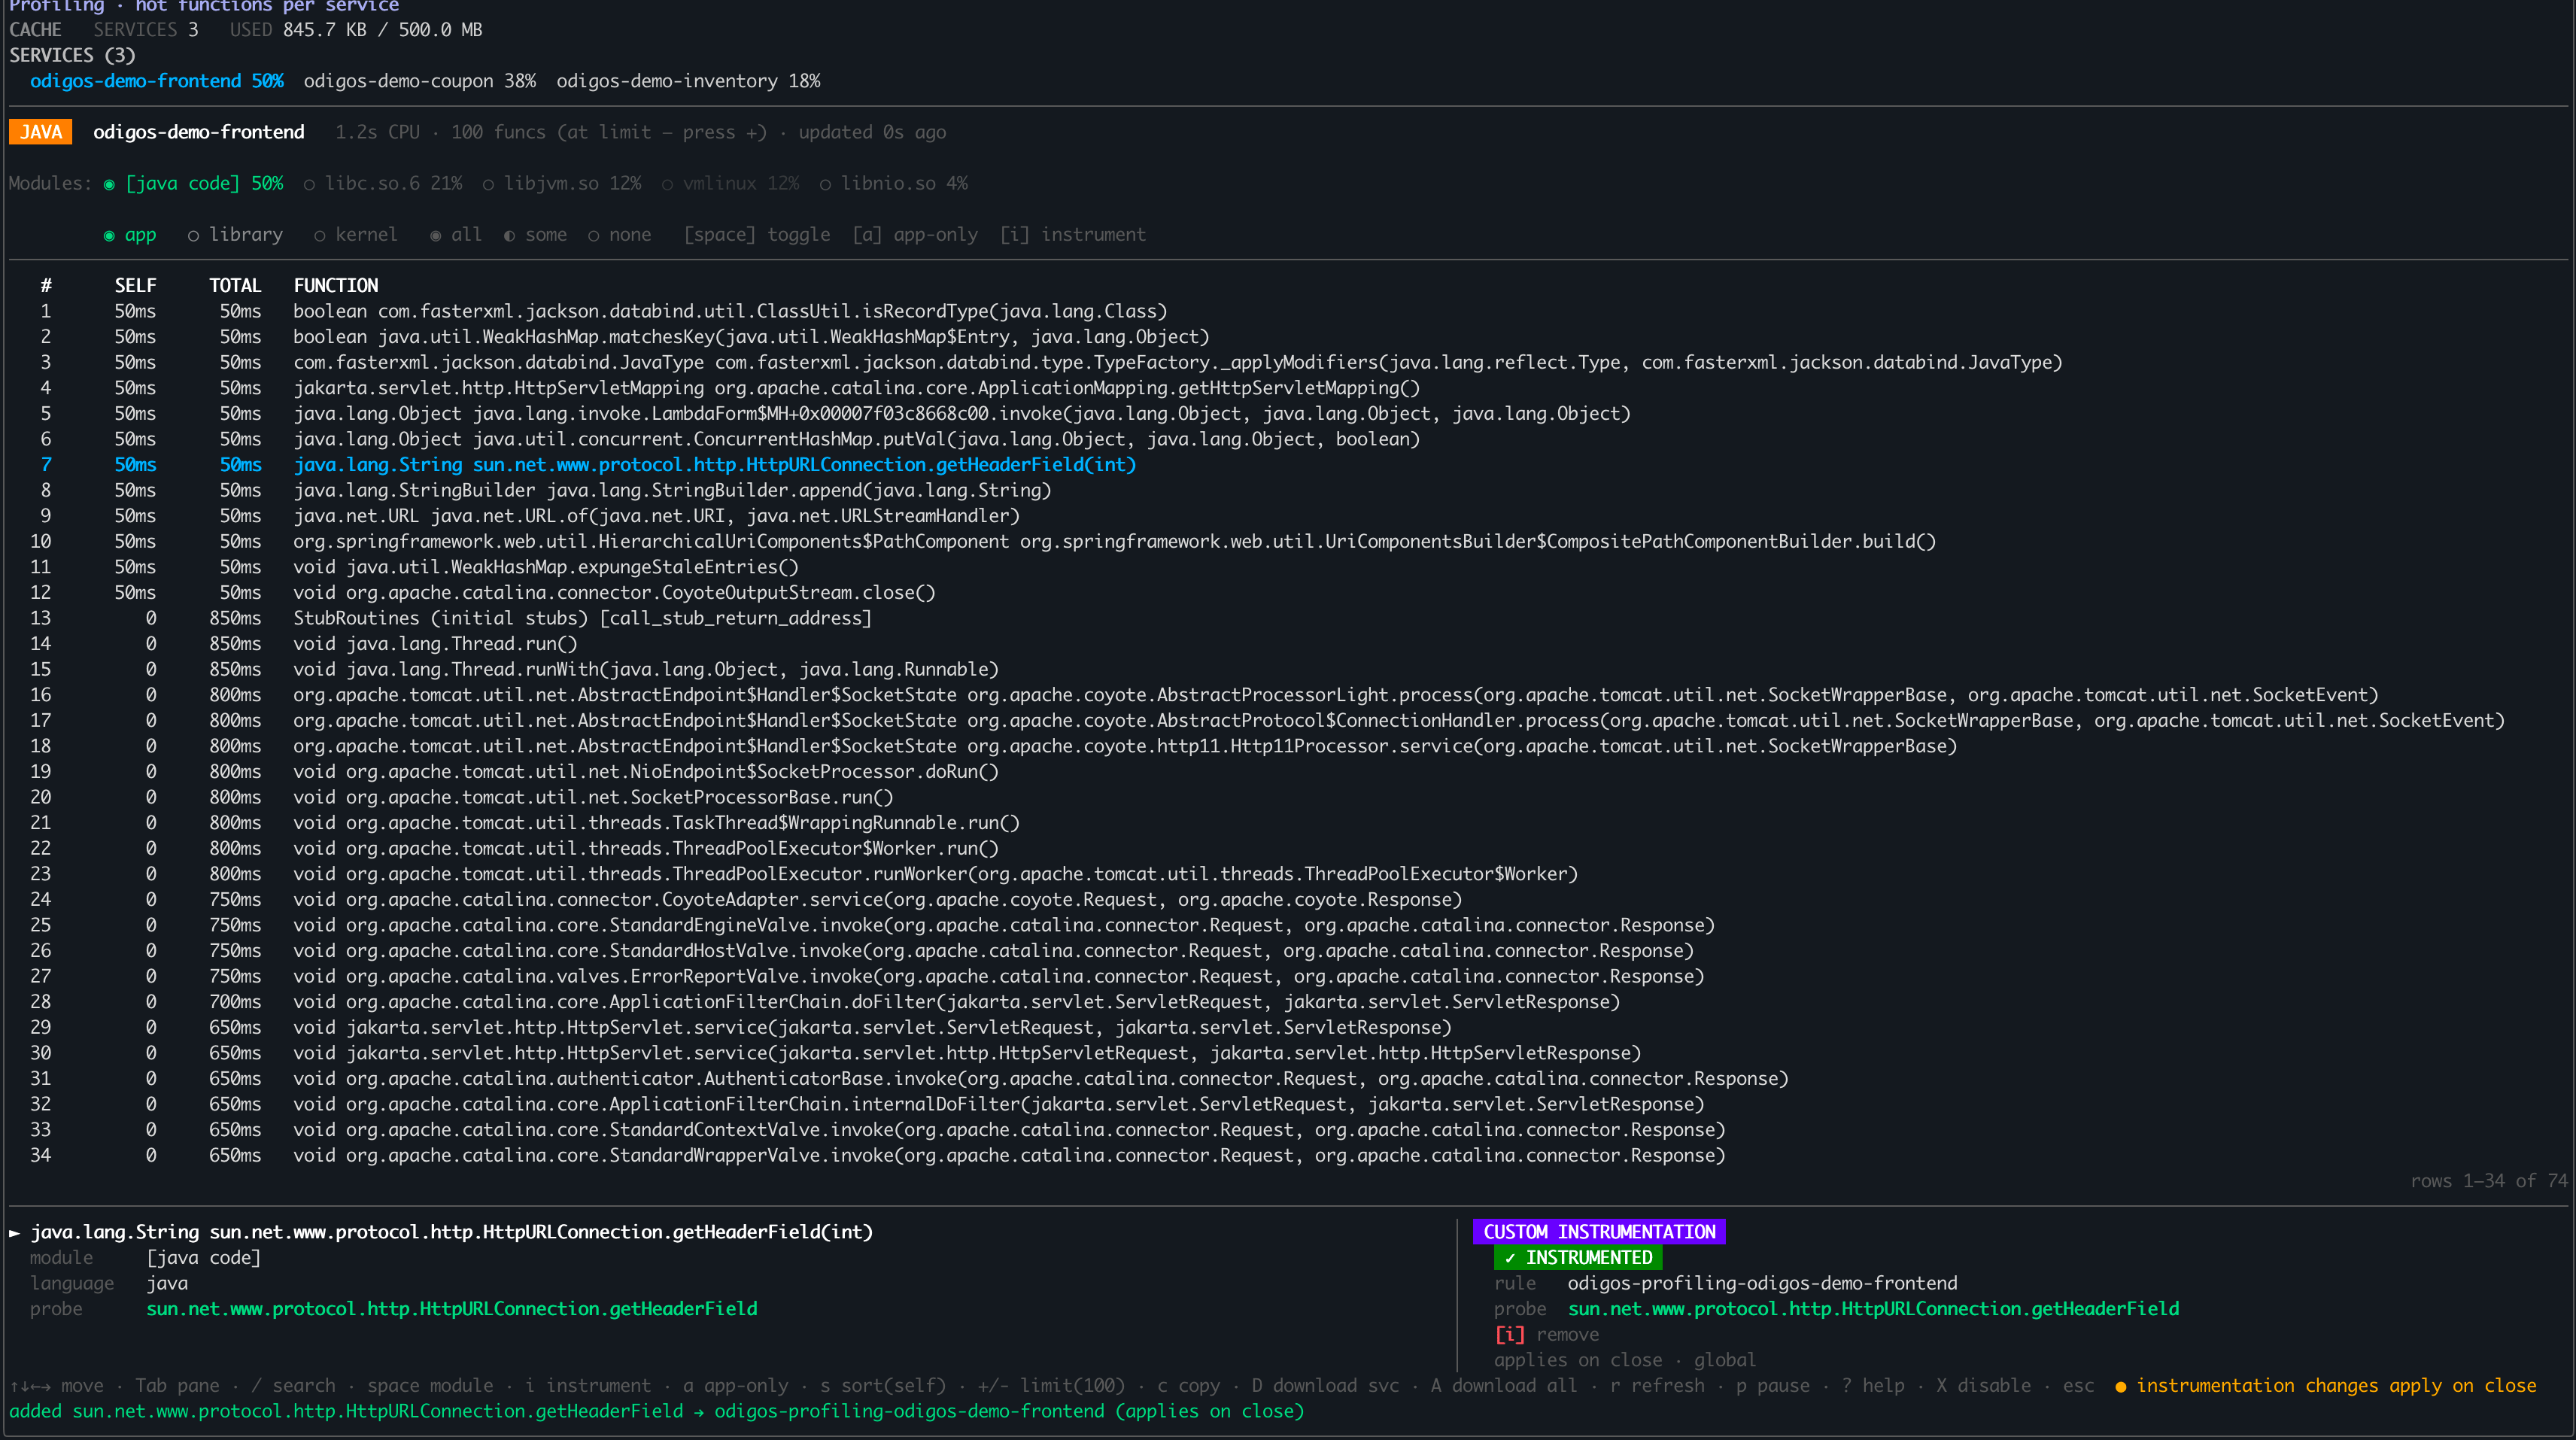
getHeaderField is now instrumented under the odigos-profiling-odigos-demo-frontend rule.Return to the dashboard
Press Esc to return to the main dashboard. A new rule appears in the Rules section, named
odigos-profiling-<service-name> for the service you selected—odigos-profiling-odigos-demo-frontend in this example.Review the generated rule
Highlight the rule to view its configuration. The generated config matches the runtime of the profiled function: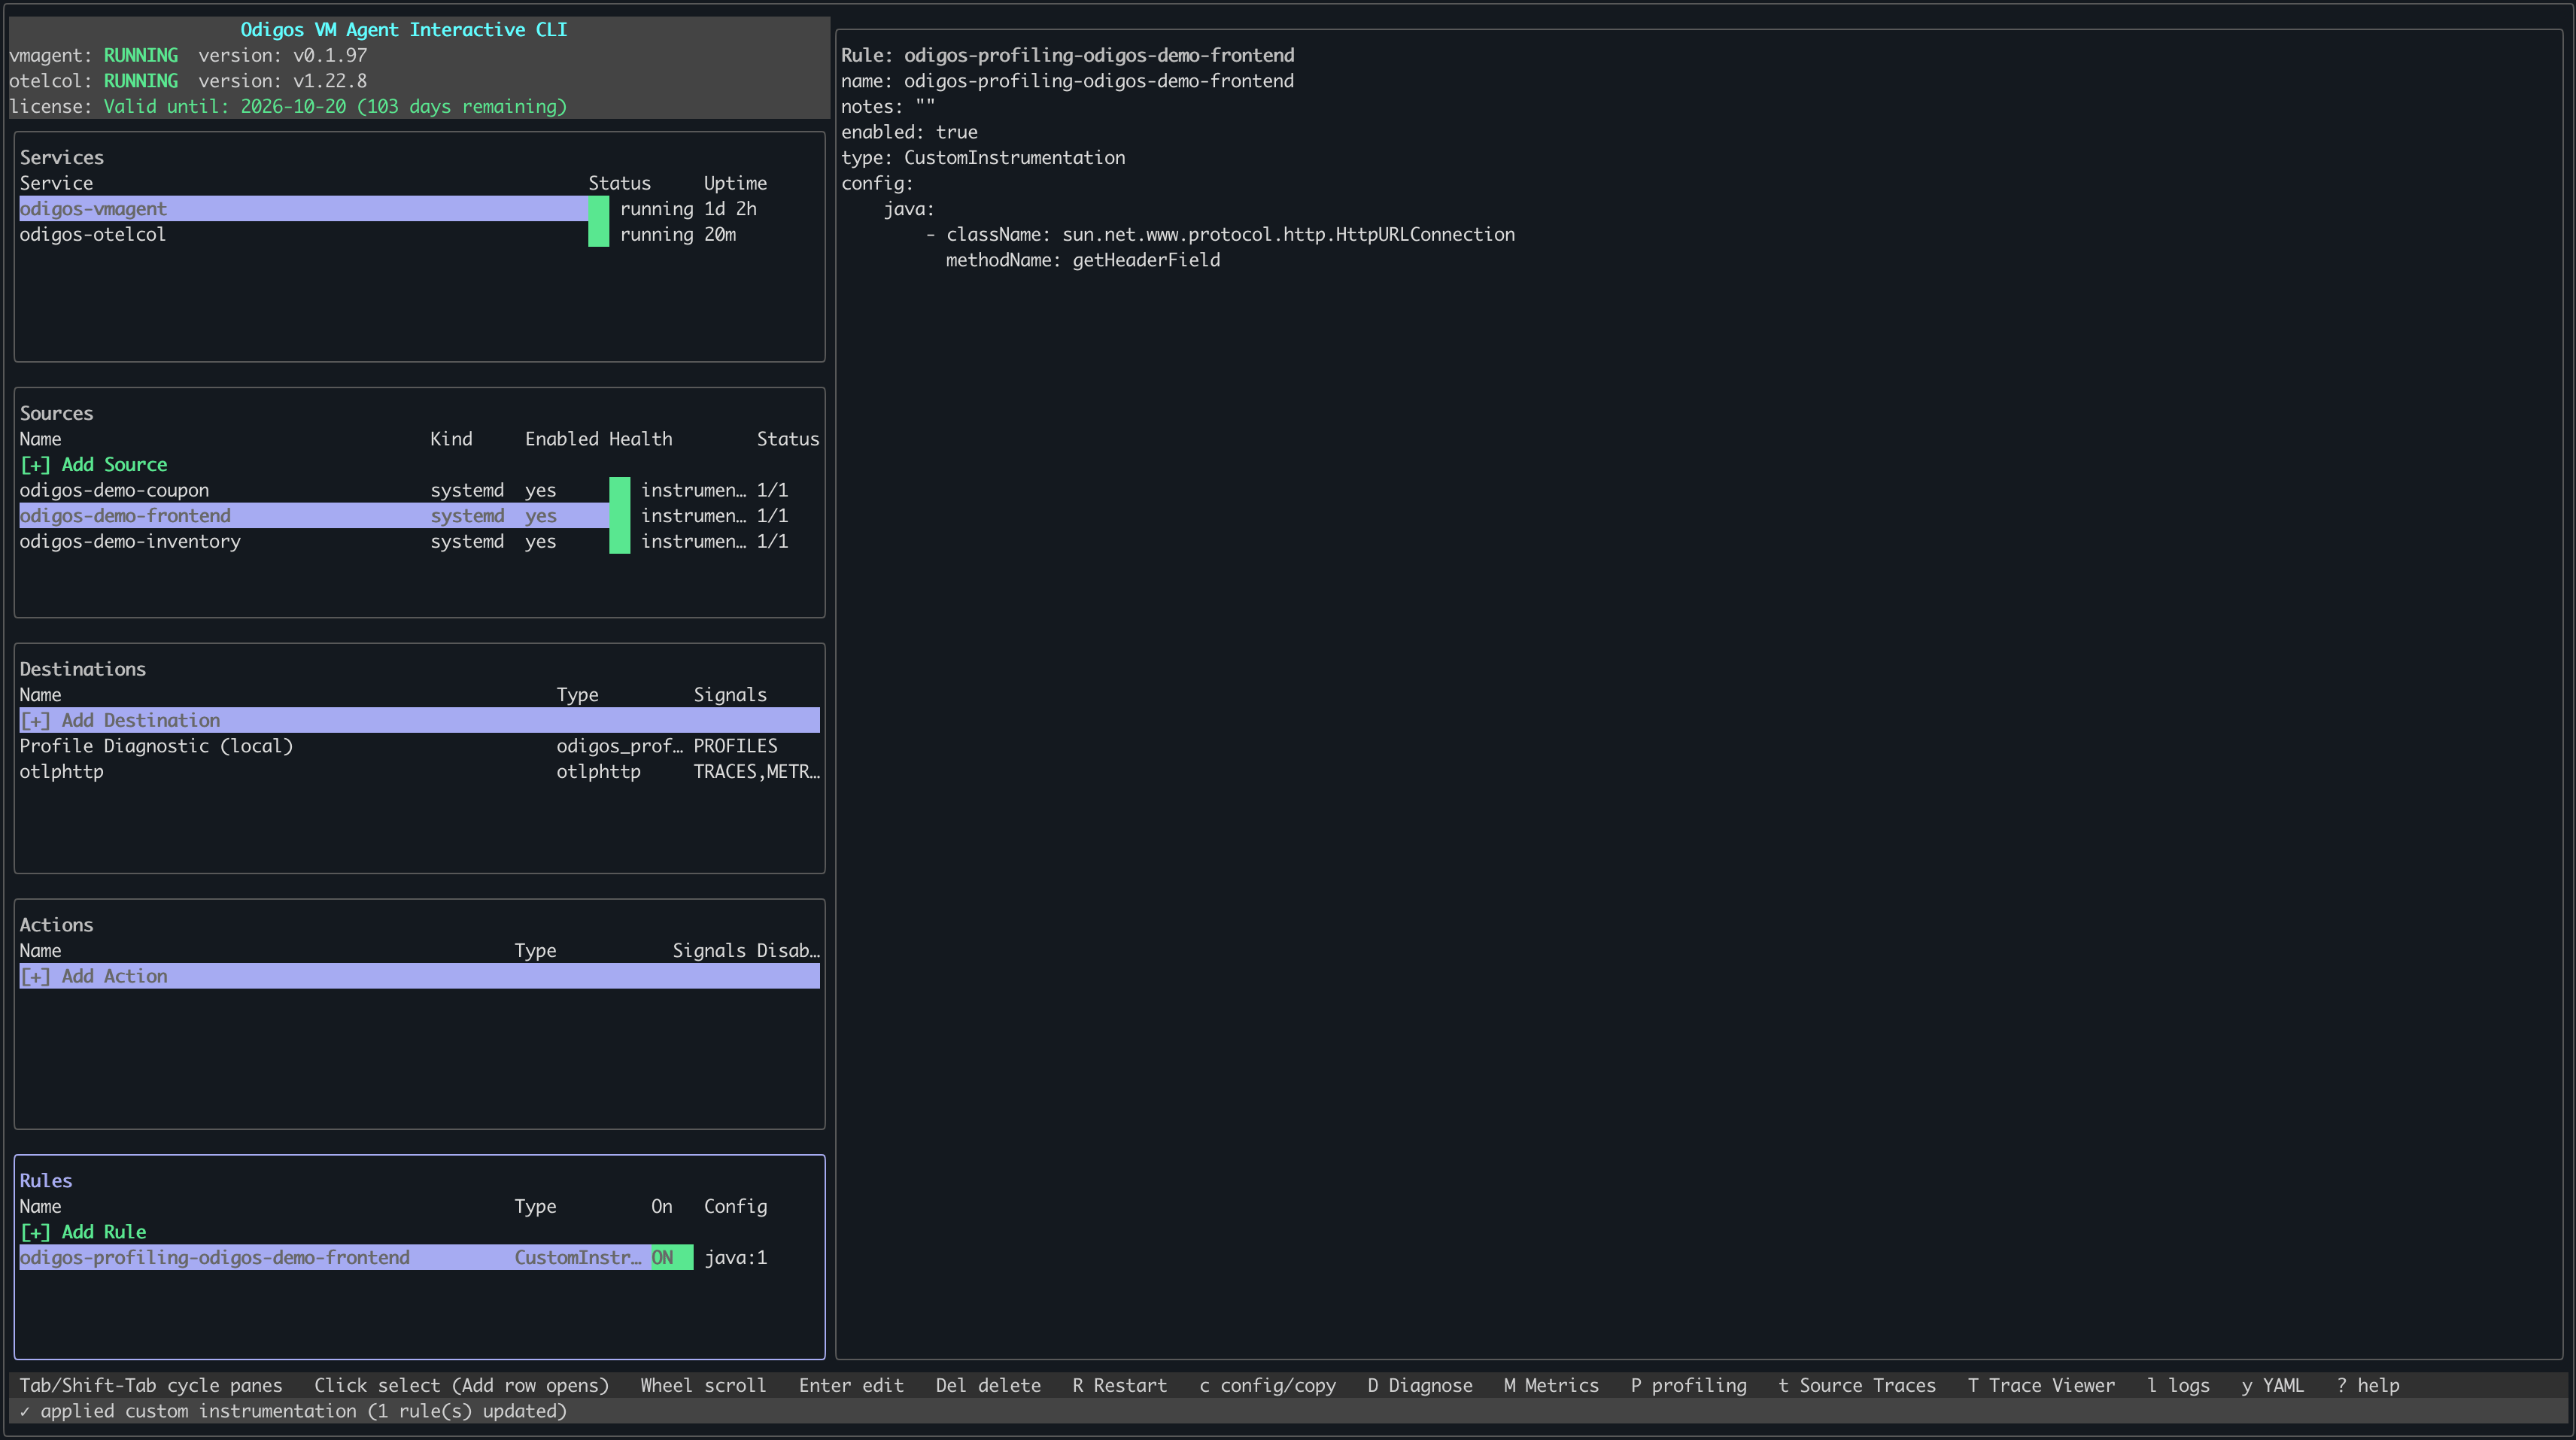
- Java — the fully qualified class name and method name.
- Go — the package and function name, or the package, receiver type, and method name.
- C++ — the function signature.
The rule name and config are generated automatically from the profile—you don’t enter the class, package, or method by hand. To author a rule manually instead, see Custom Instrumentation.
Remove a profile-driven instrumentation
To stop instrumenting a function, reopen the profiling view (Shift+P), highlight the same function, and press i again. The panel shows [i] remove for an already-instrumented function.
Related
- View profiles in odictl — open and navigate the profiling view.
- Custom Instrumentation — define rules manually with
odictlor YAML. - Instrumentation rules overview — all rule types and their benefits.